How to Set the Figure Title and Axes Labels Font Size in Matplotlib
-
Adjust
fontsizeParameter to Set Fontsize of Title and Axes in Matplotlib -
Modify Default Values of
rcParamsDictionary -
set_size()Method to Set Fontsize of Title and Axes in Matplotlib
The size and font of title and axes in Matplotlib can be set by adjusting fontsize parameter, using set_size() method, and changing values of rcParams dictionary.
Adjust fontsize Parameter to Set Fontsize of Title and Axes in Matplotlib
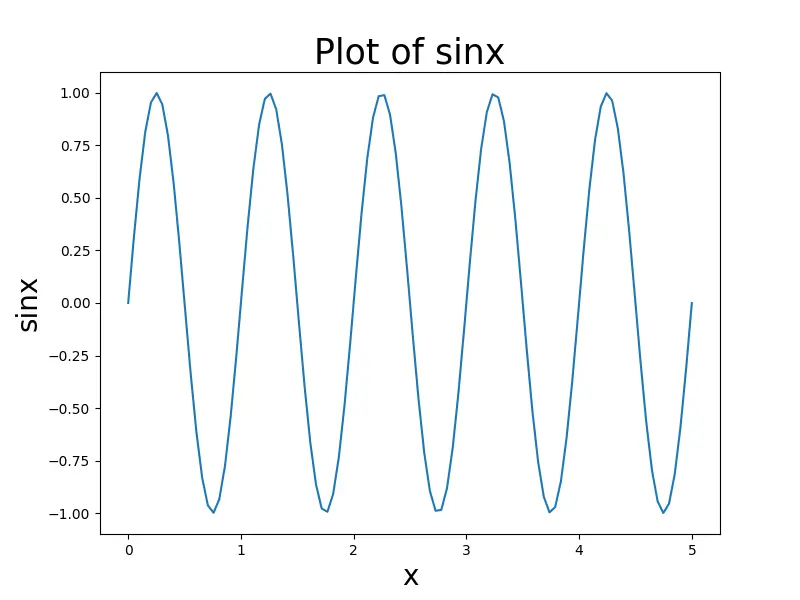
We can adjust the appropriate value of fontsize parameter in label and title methods to set the fontsize of labels and titles of plots in Matplotlib.
import numpy as np
import matplotlib.pyplot as plt

x = np.linspace(0, 5, 100)
y = np.sin(2 * np.pi * x)

fig = plt.figure(figsize=(8, 6))
plt.plot(
    x,
    y,
)
plt.title("Plot of sinx", fontsize=25)
plt.xlabel("x", fontsize=20)
plt.ylabel("sinx", fontsize=20)

plt.show()
Modify Default Values of rcParams Dictionary
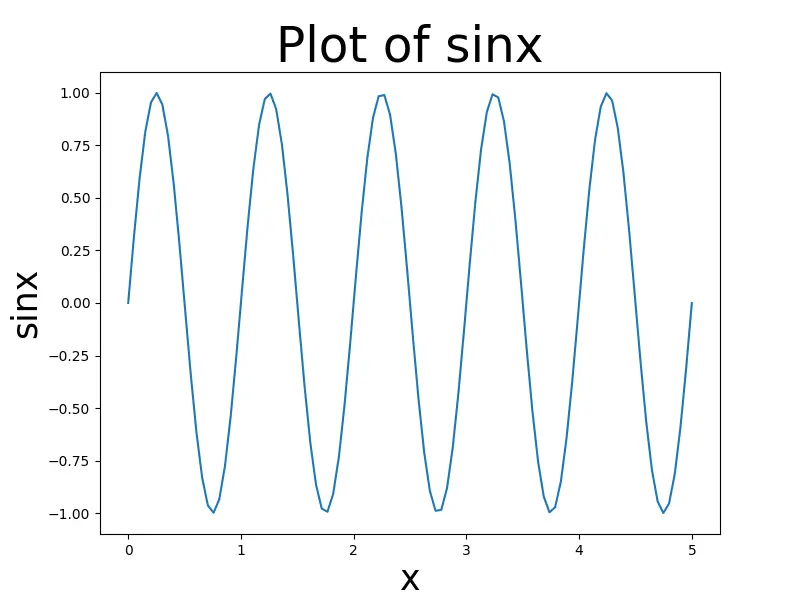
We can change default rc settings stored in a global dictionary-like variable called matplotlib.rcParams to set the fontsize of labels and title of plots in Matplotlib.
Structure of rcParams:
A complete list of the rcParams keys can be retrieved via plt.rcParams.keys() function
| Keys | Description |
|---|---|
axes.labelsize |
Fontsize of the x and y labels |
axes.titlesize |
Fontsize of the axes title |
figure.titlesize |
Size of the figure title (Figure.suptitle()) |
xtick.labelsize |
Fontsize of the tick labels |
ytick.labelsize |
Fontsize of the tick labels |
legend.fontsize |
Fontsize for legends (plt.legend(), fig.legend()) |
legend.title_fontsize |
Fontsize for legend titles, None sets to the same as the default axes. |
import numpy as np
import matplotlib.pyplot as plt

x = np.linspace(0, 5, 100)
y = np.sin(2 * np.pi * x)


parameters = {"axes.labelsize": 25, "axes.titlesize": 35}
plt.rcParams.update(parameters)

fig = plt.figure(figsize=(8, 6))
plt.plot(x, y)
plt.title("Plot of sinx")
plt.xlabel("x")
plt.ylabel("sinx")

plt.show()
set_size() Method to Set Fontsize of Title and Axes in Matplotlib
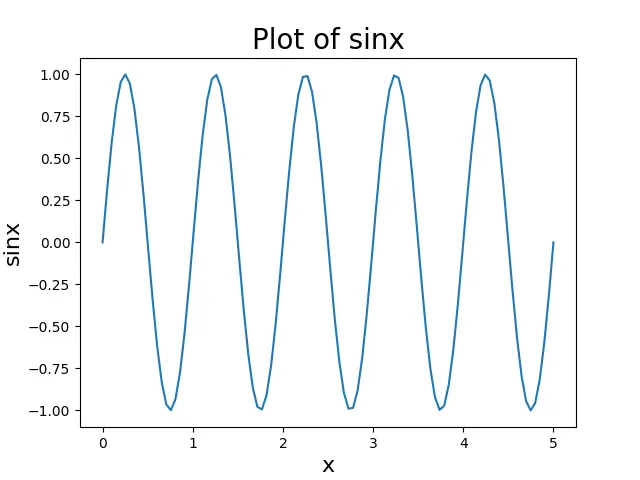
At first, we return axes of the plot using gca() method. Then we use axes.title.set_size(title_size), axes.xaxis.label.set_size(x_size) and axes.yaxis.label.set_size(y_size) to change the font sizes of the title, x-axis label and y-axis label respectively.
import numpy as np
import matplotlib.pyplot as plt

x = np.linspace(0, 5, 100)
y = np.sin(2 * np.pi * x)

axes = plt.gca()
plt.plot(x, y)
axes.set_title("Plot of sinx")
axes.set_xlabel("x")
axes.set_ylabel("sinx")

axes.title.set_size(20)
axes.xaxis.label.set_size(16)
axes.yaxis.label.set_size(16)

plt.show()

Suraj Joshi is a backend software engineer at Matrice.ai.
LinkedIn