Matplotlib에서 그림 제목 및 축 레이블 글꼴 크기를 설정하는 방법
Suraj Joshi
2023년1월30일
Matplotlib
Matplotlib Font
-
fontsize매개 변수를 조정하여 Matplotlib에서 제목 및 축의 글꼴 크기를 설정하십시오 -
rcParams사전의 기본값 수정 -
Matplotlib에서 제목과 축의 글꼴 크기를 설정하는
set_size()메소드
Matplotlib에서 제목과 축의 크기와 글꼴은 set_size() 메소드를 사용하여fontsize 매개 변수를 조정하고rcParams 사전의 값을 변경하여 설정할 수 있습니다.
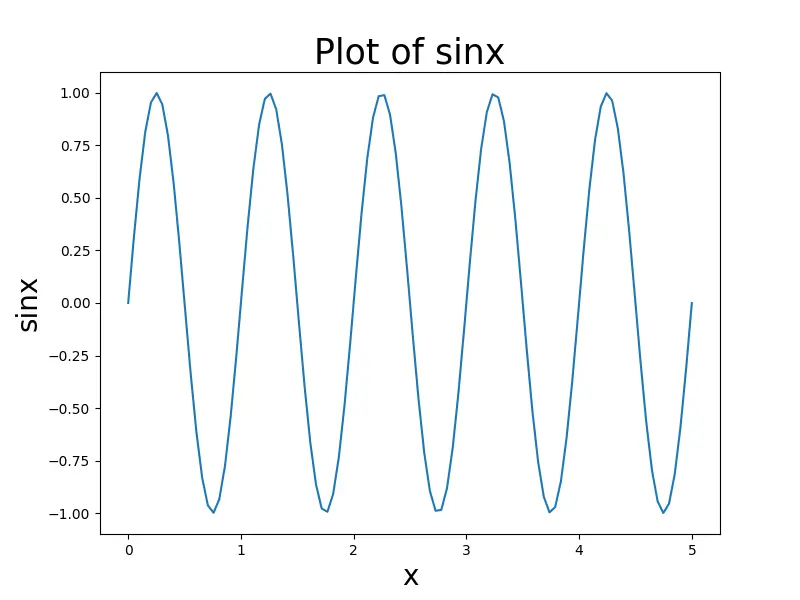
fontsize매개 변수를 조정하여 Matplotlib에서 제목 및 축의 글꼴 크기를 설정하십시오
label 및title 메소드에서fontsize 매개 변수의 적절한 값을 조정하여 Matplotlib에서 레이블의 폰트 크기와 플롯의 제목을 설정할 수 있습니다.
import numpy as np
import matplotlib.pyplot as plt

x = np.linspace(0, 5, 100)
y = np.sin(2 * np.pi * x)

fig = plt.figure(figsize=(8, 6))
plt.plot(
    x,
    y,
)
plt.title("Plot of sinx", fontsize=25)
plt.xlabel("x", fontsize=20)
plt.ylabel("sinx", fontsize=20)

plt.show()
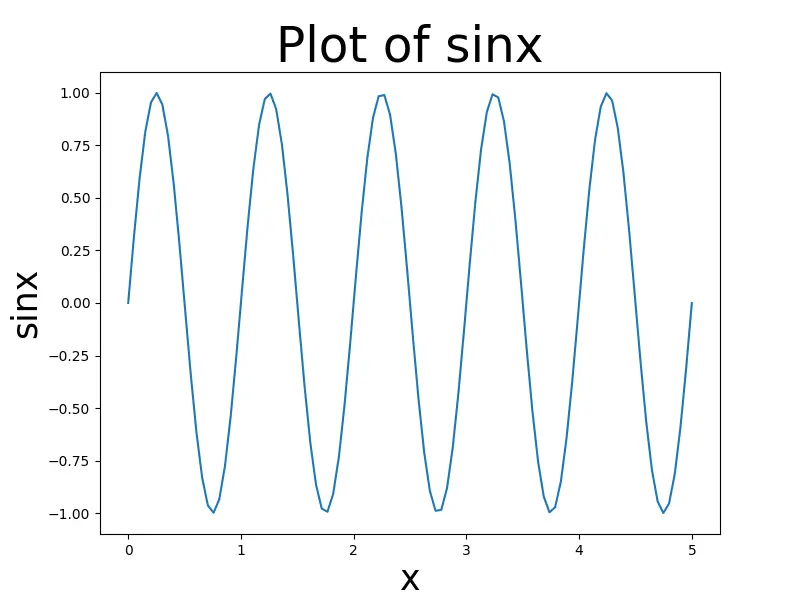
rcParams 사전의 기본값 수정
Matplotlib에서 레이블의 글꼴 크기와 플롯 제목을 설정하기 위해 matplotlib.rcParams라는 전역 사전과 같은 변수에 저장된 기본 rc설정을 변경할 수 있습니다.
rcParams의 구조:
rcParams 키의 전체 목록은plt.rcParams.keys()함수를 통해 검색 할 수 있습니다
| 열쇠 | 기술 |
|---|---|
axes.labelsize |
x 및 y 레이블의 글꼴 크기 |
axes.titlesize |
축 제목의 글꼴 크기 |
figure.titlesize |
그림 제목의 크기 (Figure.suptitle()) |
xtick.labelsize |
눈금 레이블의 글꼴 크기 |
ytick.labelsize |
눈금 레이블의 글꼴 크기 |
legend.fontsize |
범례의 글꼴 크기 (plt.legend(), fig.legend()) |
legend.title_fontsize |
범례 제목의 글꼴 크기, 없음은 기본 축과 동일하게 설정됩니다. |
import numpy as np
import matplotlib.pyplot as plt

x = np.linspace(0, 5, 100)
y = np.sin(2 * np.pi * x)


parameters = {"axes.labelsize": 25, "axes.titlesize": 35}
plt.rcParams.update(parameters)

fig = plt.figure(figsize=(8, 6))
plt.plot(x, y)
plt.title("Plot of sinx")
plt.xlabel("x")
plt.ylabel("sinx")

plt.show()
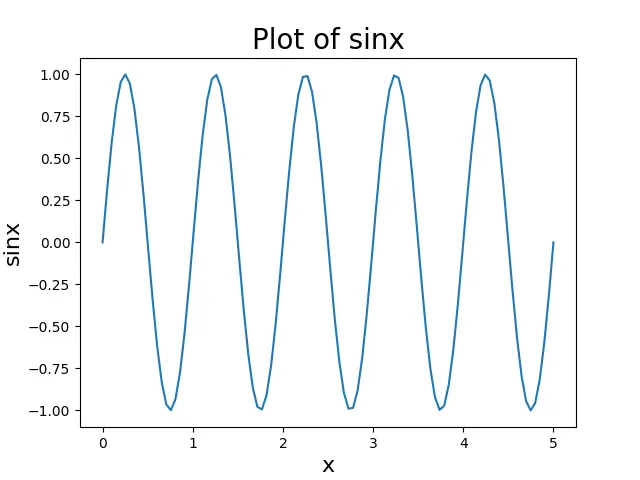
Matplotlib에서 제목과 축의 글꼴 크기를 설정하는set_size()메소드
처음에는gca()메소드를 사용하여 플롯의 축을 반환합니다. 그런 다음axes.title.set_size(title_size),axes.xaxis.label.set_size(x_size)및axes.yaxis.label.set_size(y_size)를 사용하여title의 글꼴 크기를 변경합니다, x 축 레이블및 y 축 레이블.
import numpy as np
import matplotlib.pyplot as plt

x = np.linspace(0, 5, 100)
y = np.sin(2 * np.pi * x)

axes = plt.gca()
plt.plot(x, y)
axes.set_title("Plot of sinx")
axes.set_xlabel("x")
axes.set_ylabel("sinx")

axes.title.set_size(20)
axes.xaxis.label.set_size(16)
axes.yaxis.label.set_size(16)

plt.show()
튜토리얼이 마음에 드시나요? DelftStack을 구독하세요 YouTube에서 저희가 더 많은 고품질 비디오 가이드를 제작할 수 있도록 지원해주세요. 구독하다
작가: Suraj Joshi

Suraj Joshi is a backend software engineer at Matrice.ai.
LinkedIn