The table() Function in R
The table() method is used to represent the data categorically.
This tutorial demonstrates using the table() method in R.
the table() Function in R
If you want to show the data categorically, the table() method is used to achieve that. This categorical representation is done with the given variable name and the frequency in the form of a table.
The syntax for this method is:
table(x)
In this syntax, x is the object which will be converted into a table.
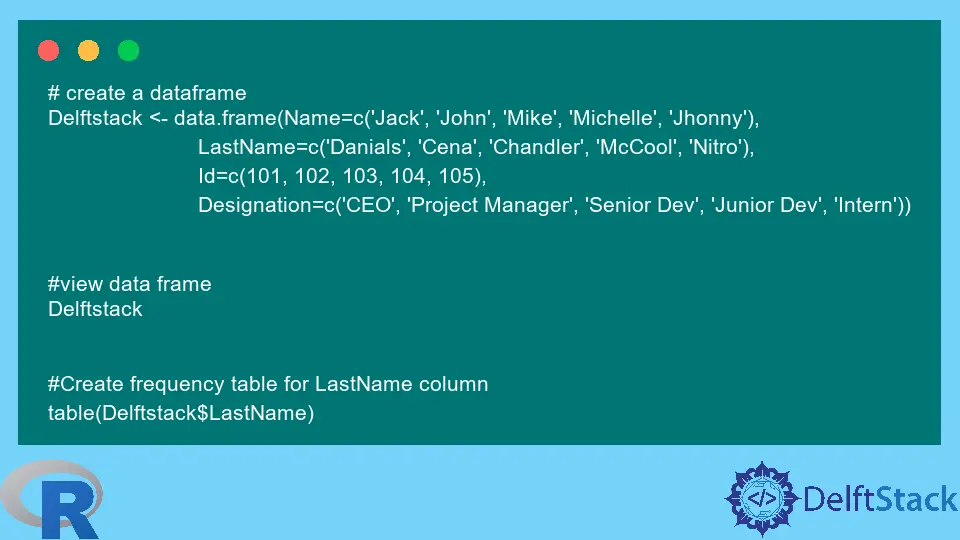
Let’s try to create a frequency table from a data frame using the table() method:
# create a dataframe
Delftstack <- data.frame(Name=c('Jack', 'John', 'Mike', 'Michelle', 'Jhonny'),
                         LastName=c('Danials', 'Cena', 'Chandler', 'McCool', 'Nitro'),
                         Id=c(101, 102, 103, 104, 105),
                         Designation=c('CEO', 'Project Manager', 'Senior Dev', 'Junior Dev', 'Intern'))


#view data frame
Delftstack


#Create frequency table for LastName column
table(Delftstack$LastName)
The code above will create a frequency table for the LastName column of the Delftstack dataframe. See output:
      Name LastName  Id     Designation
1     Jack  Danials 101             CEO
2     John     Cena 102 Project Manager
3     Mike Chandler 103      Senior Dev
4 Michelle   McCool 104      Junior Dev
5   Jhonny    Nitro 105          Intern

    Cena Chandler  Danials   McCool    Nitro
       1        1        1        1        1
Similarly, we can create frequency table of proportions for the same column using the prop.table() and table() method. Let’s try an example:
#calculate frequency table of proportions for LastName Column
prop.table(table(Delftstack$LastName))
The code above will create the frequency table of proportions for the given column or variable. See output:
    Cena Chandler  Danials   McCool    Nitro
     0.2      0.2      0.2      0.2      0.2
The data above shows that each last name is given to 20% of persons in the dataframe. Similarly, we can calculate the frequency table for two variables.
See example:
#Create frequency table for Name and LastName column
table(Delftstack$Name, Delftstack$LastName)
The code above will create the frequency table for the Name and LastName columns. See output:
           Cena Chandler Danials McCool Nitro
  Jack        0        0       1      0     0
  Jhonny      0        0       0      0     1
  John        1        0       0      0     0
  Michelle    0        0       0      1     0
  Mike        0        1       0      0     0
The code above matches the Name to the LastName; for example, for Jack, the Danials is the last name because it has the frequency 1. Similarly, we can create a frequency table of proportions for two variables.
See example:
#calculate frequency table of proportions for Name and LastName Column
prop.table(table(Delftstack$Name, Delftstack$LastName))
The code above will calculate the frequency table of proportions for two columns, Name and LastName. See output:
           Cena Chandler Danials McCool Nitro
  Jack      0.0      0.0     0.2    0.0   0.0
  Jhonny    0.0      0.0     0.0    0.0   0.2
  John      0.2      0.0     0.0    0.0   0.0
  Michelle  0.0      0.0     0.0    0.2   0.0
  Mike      0.0      0.2     0.0    0.0   0.0
Here is the complete code for calculating the frequency table and the frequency table of proportions for single and multiple variables or columns.
# create a dataframe
Delftstack <- data.frame(Name=c('Jack', 'John', 'Mike', 'Michelle', 'Jhonny'),
                         LastName=c('Danials', 'Cena', 'Chandler', 'McCool', 'Nitro'),
                         Id=c(101, 102, 103, 104, 105),
                         Designation=c('CEO', 'Project Manager', 'Senior Dev', 'Junior Dev', 'Intern'))


#view data frame
Delftstack


#Create frequency table for LastName column
table(Delftstack$LastName)

#calculate frequency table of proportions for LastName Column
prop.table(table(Delftstack$LastName))

#Create frequency table for Name and LastName column
table(Delftstack$Name, Delftstack$LastName)

#calculate frequency table of proportions for Name and LastName Column
prop.table(table(Delftstack$Name, Delftstack$LastName))

Sheeraz is a Doctorate fellow in Computer Science at Northwestern Polytechnical University, Xian, China. He has 7 years of Software Development experience in AI, Web, Database, and Desktop technologies. He writes tutorials in Java, PHP, Python, GoLang, R, etc., to help beginners learn the field of Computer Science.
LinkedIn Facebook