Contingency Table in R
The contingency table, also known as crosstabs, are the tables to summarize the relationship between two variables.
This tutorial demonstrates how to create contingency tables in R.
Contingency Table in R
In R, it is very easy to create a contingency table. Suppose we have a data set that has the information of 20 employees, including id, office name, and employee position.
To create the contingency table, we use the table function in R. See the example:
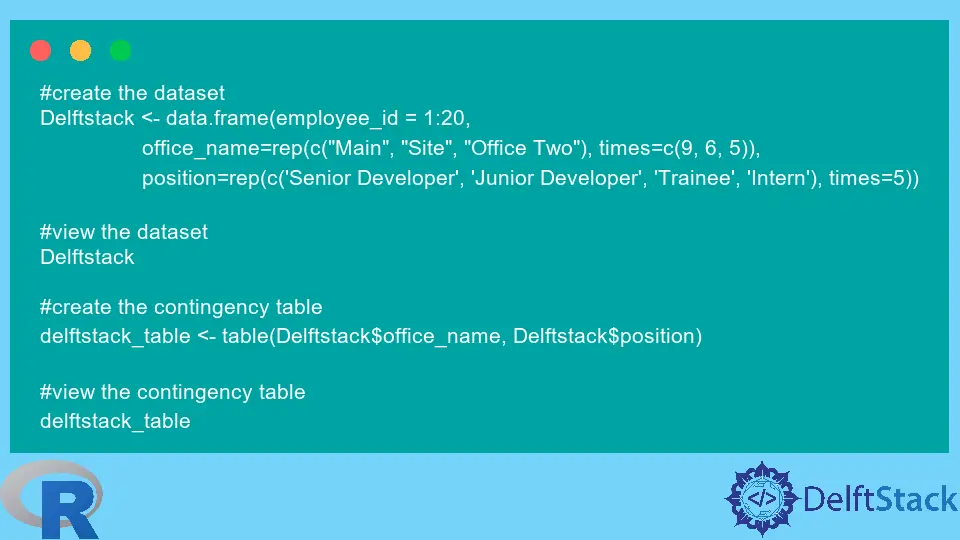
#create the dataset
Delftstack <- data.frame(employee_id = 1:20,
                 office_name=rep(c("Main", "Site", "Office Two"), times=c(9, 6, 5)),
                 position=rep(c('Senior Developer', 'Junior Developer', 'Trainee', 'Intern'), times=5))

#view the dataset
Delftstack

#create the contingency table
delftstack_table <- table(Delftstack$office_name, Delftstack$position)

#view the contingency table
delftstack_table
The code above will first create a data set with 20 records and then create a contingency table from the data set. See output:
   employee_id office_name         position
1            1        Main Senior Developer
2            2        Main Junior Developer
3            3        Main          Trainee
4            4        Main           Intern
5            5        Main Senior Developer
6            6        Main Junior Developer
7            7        Main          Trainee
8            8        Main           Intern
9            9        Main Senior Developer
10          10        Site Junior Developer
11          11        Site          Trainee
12          12        Site           Intern
13          13        Site Senior Developer
14          14        Site Junior Developer
15          15        Site          Trainee
16          16  Office Two           Intern
17          17  Office Two Senior Developer
18          18  Office Two Junior Developer
19          19  Office Two          Trainee
20          20  Office Two           Intern

             Intern Junior Developer Senior Developer Trainee
  Main            2                2                3       2
  Office Two      2                1                1       1
  Site            1                2                1       2
We can use addmargins() function to add margin to the contingency table. See example:
#add margins to contingency table
delftstack_margins <- addmargins(delftstack_table)

#view contingency table
delftstack_margins
The code above will add margins to the contingency table. See output:
             Intern Junior Developer Senior Developer Trainee Sum
  Main            2                2                3       2   9
  Office Two      2                1                1       1   5
  Site            1                2                1       2   6
  Sum             5                5                5       5  20
This output shows that the total number of employees is 20; the values above 20 show the total number of employees in the corresponding office, which means the office has 9 employees, office two has 5, and the site office has 6 employees. And the columns in between show the number of employees with their position.

Sheeraz is a Doctorate fellow in Computer Science at Northwestern Polytechnical University, Xian, China. He has 7 years of Software Development experience in AI, Web, Database, and Desktop technologies. He writes tutorials in Java, PHP, Python, GoLang, R, etc., to help beginners learn the field of Computer Science.
LinkedIn Facebook