R の分割表
分割表は、クロス集計とも呼ばれ、2つの変数間の関係を要約するための表です。このチュートリアルでは、R で分割表を作成する方法を示します。
R の分割表
R では、分割表を作成するのは非常に簡単です。ID、オフィス名、従業員の役職など、20 人の従業員の情報を含むデータセットがあるとします。
分割表を作成するには、R のテーブル関数を使用します。例を参照してください。
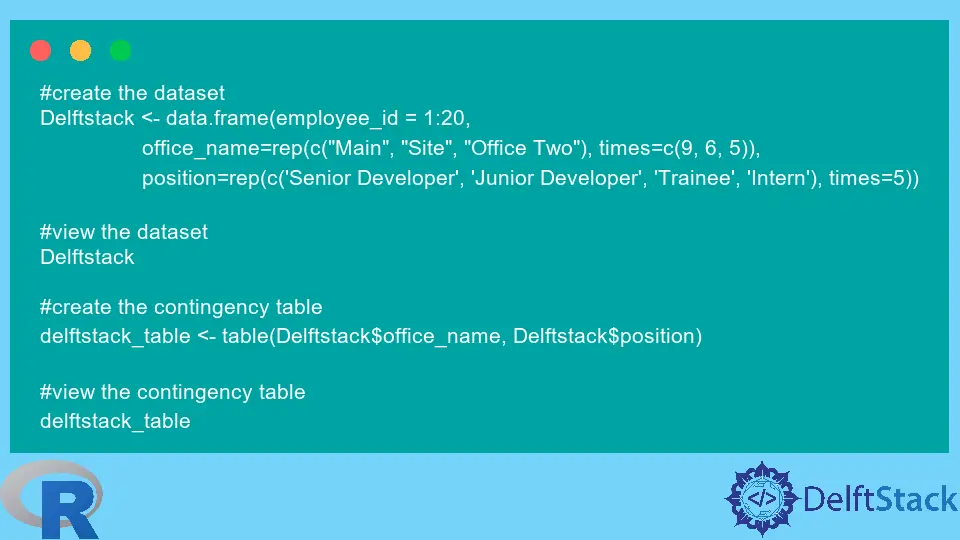
#create the dataset
Delftstack <- data.frame(employee_id = 1:20,
                 office_name=rep(c("Main", "Site", "Office Two"), times=c(9, 6, 5)),
                 position=rep(c('Senior Developer', 'Junior Developer', 'Trainee', 'Intern'), times=5))

#view the dataset
Delftstack

#create the contingency table
delftstack_table <- table(Delftstack$office_name, Delftstack$position)

#view the contingency table
delftstack_table
上記のコードは、最初に 20 レコードのデータセットを作成し、次にデータセットから分割表を作成します。出力を参照してください:
   employee_id office_name         position
1            1        Main Senior Developer
2            2        Main Junior Developer
3            3        Main          Trainee
4            4        Main           Intern
5            5        Main Senior Developer
6            6        Main Junior Developer
7            7        Main          Trainee
8            8        Main           Intern
9            9        Main Senior Developer
10          10        Site Junior Developer
11          11        Site          Trainee
12          12        Site           Intern
13          13        Site Senior Developer
14          14        Site Junior Developer
15          15        Site          Trainee
16          16  Office Two           Intern
17          17  Office Two Senior Developer
18          18  Office Two Junior Developer
19          19  Office Two          Trainee
20          20  Office Two           Intern

             Intern Junior Developer Senior Developer Trainee
  Main            2                2                3       2
  Office Two      2                1                1       1
  Site            1                2                1       2
addmargins() 関数を使用して、分割表にマージンを追加できます。例を参照してください:
#add margins to contingency table
delftstack_margins <- addmargins(delftstack_table)

#view contingency table
delftstack_margins
上記のコードは分割表にマージンを追加します。出力を参照してください:
             Intern Junior Developer Senior Developer Trainee Sum
  Main            2                2                3       2   9
  Office Two      2                1                1       1   5
  Site            1                2                1       2   6
  Sum             5                5                5       5  20
この出力は、従業員の総数が 20 人であることを示しています。20 を超える値は、対応するオフィスの従業員の総数を示します。つまり、オフィスには 9 人、オフィス 2 には 5 人、サイトオフィスには 6 人の従業員がいます。そして、その間の列は、従業員の数とその位置を示しています。

Sheeraz is a Doctorate fellow in Computer Science at Northwestern Polytechnical University, Xian, China. He has 7 years of Software Development experience in AI, Web, Database, and Desktop technologies. He writes tutorials in Java, PHP, Python, GoLang, R, etc., to help beginners learn the field of Computer Science.
LinkedIn Facebook