R 中的列聯表
Sheeraz Gul
2022年5月26日
R
R Table
列聯表,也稱為交叉表,是總結兩個變數之間關係的表格。本教程演示如何在 R 中建立列聯表。
R 中的列聯表
在 R 中,建立列聯表非常容易。假設我們有一個資料集,其中包含 20 名員工的資訊,包括 id、辦公室名稱和員工職位。
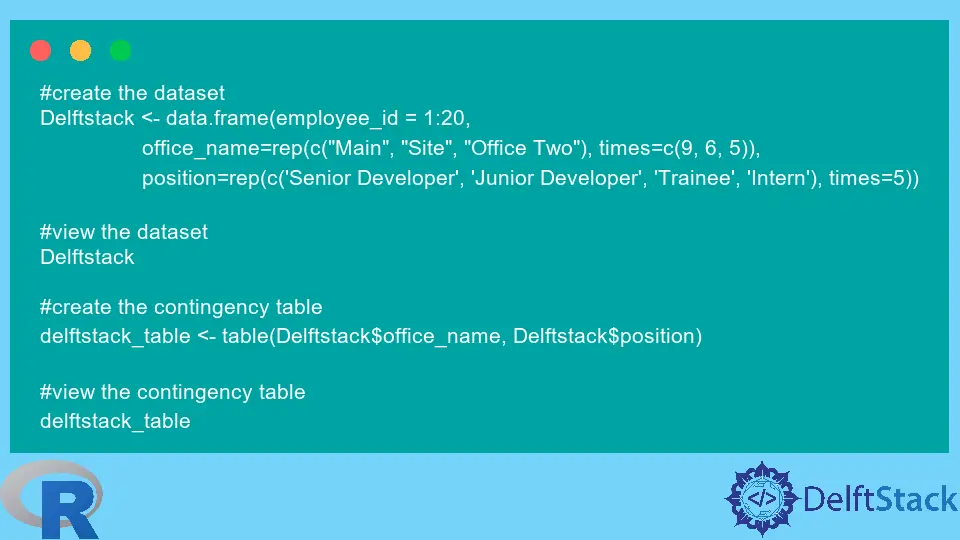
要建立列聯表,我們使用 R 中的 table 函式。參見示例:
#create the dataset
Delftstack <- data.frame(employee_id = 1:20,
                 office_name=rep(c("Main", "Site", "Office Two"), times=c(9, 6, 5)),
                 position=rep(c('Senior Developer', 'Junior Developer', 'Trainee', 'Intern'), times=5))

#view the dataset
Delftstack

#create the contingency table
delftstack_table <- table(Delftstack$office_name, Delftstack$position)

#view the contingency table
delftstack_table
上面的程式碼將首先建立一個包含 20 條記錄的資料集,然後從該資料集建立一個列聯表。見輸出:
   employee_id office_name         position
1            1        Main Senior Developer
2            2        Main Junior Developer
3            3        Main          Trainee
4            4        Main           Intern
5            5        Main Senior Developer
6            6        Main Junior Developer
7            7        Main          Trainee
8            8        Main           Intern
9            9        Main Senior Developer
10          10        Site Junior Developer
11          11        Site          Trainee
12          12        Site           Intern
13          13        Site Senior Developer
14          14        Site Junior Developer
15          15        Site          Trainee
16          16  Office Two           Intern
17          17  Office Two Senior Developer
18          18  Office Two Junior Developer
19          19  Office Two          Trainee
20          20  Office Two           Intern

             Intern Junior Developer Senior Developer Trainee
  Main            2                2                3       2
  Office Two      2                1                1       1
  Site            1                2                1       2
我們可以使用 addmargins() 函式向列聯表新增邊距。參見示例:
#add margins to contingency table
delftstack_margins <- addmargins(delftstack_table)

#view contingency table
delftstack_margins
上面的程式碼將為列聯表新增邊距。見輸出:
             Intern Junior Developer Senior Developer Trainee Sum
  Main            2                2                3       2   9
  Office Two      2                1                1       1   5
  Site            1                2                1       2   6
  Sum             5                5                5       5  20
此輸出顯示員工總數為 20; 20 以上的數值表示對應辦公室的員工總數,即辦公室有 9 名員工,辦公室二有 5 名員工,現場辦公室有 6 名員工。中間的列顯示了其職位的員工人數。
Enjoying our tutorials? Subscribe to DelftStack on YouTube to support us in creating more high-quality video guides. Subscribe
作者: Sheeraz Gul

Sheeraz is a Doctorate fellow in Computer Science at Northwestern Polytechnical University, Xian, China. He has 7 years of Software Development experience in AI, Web, Database, and Desktop technologies. He writes tutorials in Java, PHP, Python, GoLang, R, etc., to help beginners learn the field of Computer Science.
LinkedIn Facebook