How to Implement Linear Regression in Python
- What Is Regression?
- What Is Linear Regression?
- Implementation of Simple Linear Regression in Python
- Implementation of Multiple Regression in Python

In this article, we will discuss linear regression and will see how linear regression is used to predict outcomes. We will also implement simple linear regression and multiple regression in Python.
What Is Regression?
Regression is the process of identifying relationships between independent variables and dependent variables. It is used to predict house prices, employees’ salaries, and other forecasting applications.
If we want to predict house prices, the independent variables may include the age of the house, number of bedrooms, distance from the central city locations like airports, markets, etc. Here, the price of the house will depend on these independent variables. Hence, the price of the house is a dependent variable.
Similarly, if we want to predict the salary of employees, the independent variables might be their experience in years, level of education, living cost of the place they reside, etc. Here, the dependent variable is the salary of the employees.
With regression, we try to establish a mathematical model describing how the independent variables affect the dependent variables. The mathematical model should predict the dependent variable with the least error when values for independent variables are provided.
What Is Linear Regression?
In linear regression, the independent and dependent variables are assumed to be related linearly.
Suppose that we are given N independent variables as follows.
Now, we need to find a linear relationship like the following equation.
Here,
- We have to identify the constants
Aiusing linear regression to predict the dependent variableF(X)with minimum errors when the independent variables are given. - The constants Ai are called predicted weights or estimators of the regression coefficients.
- F(X) is called the predicted response or the estimated response of the regression. For a given
X=( X1, X2, X3, X4, X5, X6, X7……, XN),F(X)should evaluate to a value that is as close as possible to the actual dependent variable Y for the given independent variable X. - To calculate the function F(X) that evaluates to the closest Y, we normally minimize the root mean square of the difference between F(X) and Y for the given values of X.
Implementation of Simple Linear Regression in Python
There is only one independent variable and a dependent variable in simple regression. So, the predicted response can be written as follows.
To implement the simple linear regression in Python, we need some actual values for X and their corresponding Y values. With those values, we can calculate the predicted weights A0 and A1 mathematically or by using the functions provided in Python.
Suppose that we are given ten values for X in the form of an array as follows.
X = [1, 2, 3, 4, 5, 6, 7, 8, 9, 10]
Also, the corresponding Y values are given as follows.
Y = [2, 4, 3, 6, 8, 9, 9, 10, 11, 13]
To find the regression equation F(X), we can use the linear_model module from the scikit-learn machine learning library. You can install the scikit-learn library by executing the following command in the command prompt of your machine.
pip3 install scikit-learn
The linear_model module of the scikit-learn library provides us with the LinearRegression() method that we can use to find the predicted response. The LinearRegression() method, when executed, returns a linear model. We can train this linear model to find F(X). For this, we use the fit() method.
The fit() method, when invoked on a linear model, accepts the array of independent variables X as its first argument and the array of dependent variables Y as its second input argument. After execution, the parameters of the linear model are adjusted in such a way that the model represents F(X). You can find the values for A0 and A1 using the intercept_ and coef_ attributes, respectively, as shown below.
from sklearn import linear_model
import numpy as np

X = np.array([1, 2, 3, 4, 5, 6, 7, 8, 9, 10]).reshape(-1, 1)
Y = [2, 4, 3, 6, 8, 9, 9, 10, 11, 13]
lm = linear_model.LinearRegression()
lm.fit(X, Y)  # fitting the model
print("The coefficient is:", lm.coef_)
print("The intercept is:", lm.intercept_)
Output:
The coefficient is: [1.16969697]
The intercept is: 1.0666666666666664
Here, you can see that the coefficient value A1 is 1.16969697 and the intercept value A0 is 1.0666666666666664.
After implementing the linear regression model, you can predict the value of Y for any X using the predict() method. When invoked on a model, the predict() method takes the independent variable X as input argument and returns the predicted value for the dependent variable Y, as shown in the following example.
from sklearn import linear_model
import numpy as np

X = np.array([1, 2, 3, 4, 5, 6, 7, 8, 9, 10]).reshape(-1, 1)
Y = [2, 4, 3, 6, 8, 9, 9, 10, 11, 13]
lm = linear_model.LinearRegression()
lm.fit(X, Y)  # fitting the model
Z = np.array([1, 5, 15, 56, 27]).reshape(-1, 1)
print("The input values are:", Z)
output = lm.predict(Z)
print("The predicted values are:", output)
Output:
The input values are: [[ 1]
 [ 5]
 [15]
 [56]
 [27]]
The predicted values are: [ 2.23636364  6.91515152 18.61212121 66.56969697 32.64848485]
Here, you can see that we have provided different values of X to the predict() method, and it has returned the corresponding predicted value for each input value.
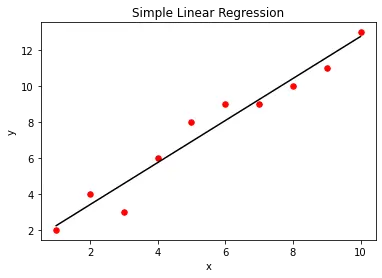
We can visualize the simple linear regression model using the matplotlib library function. For this, we first create a scatter plot of the actual X and Y values provided as input. After creating the linear regression model, we will plot the output of the regression model against X using the predict() method. This will give us a straight line representing the regression model, as shown below.
from sklearn import linear_model
import numpy as np
import matplotlib.pyplot as plt

X = np.array([1, 2, 3, 4, 5, 6, 7, 8, 9, 10]).reshape(-1, 1)
Y = [2, 4, 3, 6, 8, 9, 9, 10, 11, 13]
lm = linear_model.LinearRegression()
lm.fit(X, Y)
plt.scatter(X, Y, color="r", marker="o", s=30)
y_pred = lm.predict(X)
plt.plot(X, y_pred, color="k")
plt.xlabel("x")
plt.ylabel("y")
plt.title("Simple Linear Regression")
plt.show()
Output:
Implementation of Multiple Regression in Python
In multiple regression, we have more than one independent variable. For instance, let there be two independent variables X1 and X2, and their dependent variable Y given as follows.
X1 = [1, 2, 3, 4, 5, 6, 7, 8, 9, 10]
X2 = [5, 7, 7, 8, 9, 9, 10, 11, 12, 13]
Y = [5, 7, 6, 9, 11, 12, 12, 13, 14, 16]
Here each ith value in X1, X2, and Y forms a triplet where the ith element of the array Y is determined using the ith element of the array X1 and ith element of the array X2.
To implement multiple regression in Python, we will create an array X from X1 and X2 as follows.
X1 = [1, 2, 3, 4, 5, 6, 7, 8, 9, 10]
X2 = [5, 7, 7, 8, 9, 9, 10, 11, 12, 13]
X = [
    (1, 5),
    (2, 7),
    (3, 7),
    (4, 8),
    (5, 9),
    (6, 9),
    (7, 10),
    (8, 11),
    (9, 12),
    (10, 13),
]
To create X from X1 and X2, we will use the zip() method. The zip() method takes different iterable objects as input and returns an iterator containing the elements paired. As shown below, we can convert the iterator into a list using the list() constructor.
X1 = [1, 2, 3, 4, 5, 6, 7, 8, 9, 10]
X2 = [5, 7, 7, 8, 9, 9, 10, 11, 12, 13]
print("X1:", X1)
print("X2:", X2)
X = list(zip(X1, X2))
print("X:", X)
Output:
X1: [1, 2, 3, 4, 5, 6, 7, 8, 9, 10]
X2: [5, 7, 7, 8, 9, 9, 10, 11, 12, 13]
X: [(1, 5), (2, 7), (3, 7), (4, 8), (5, 9), (6, 9), (7, 10), (8, 11), (9, 12), (10, 13)]
After obtaining X, we need to find F(X)= A0+A1X1+A2X2.
For this, we can pass the feature matrix X and the dependent variable array Y to the fit() method. When executed, the fit() method adjusts the constants A0, A1, and A2 such that the model represents the multiple regression model F(X). You can find the values A1 and A2 using the coef_ attribute and the value A0 using the intercept_ attribute as shown below.
from sklearn import linear_model
import numpy as np

X1 = np.array([1, 2, 3, 4, 5, 6, 7, 8, 9, 10])
X2 = np.array([5, 7, 7, 8, 9, 9, 10, 11, 12, 13])
Y = [5, 7, 6, 9, 11, 12, 12, 13, 14, 16]
X = list(zip(X1, X2))
lm = linear_model.LinearRegression()
lm.fit(X, Y)  # fitting the model
print("The coefficient is:", lm.coef_)
print("The intercept is:", lm.intercept_)
Output:
The coefficient is: [0.72523364 0.55140187]
The intercept is: 1.4934579439252396
Here, you can see that the coefficient is an array. The first element of the array represents A1 while the second element of the array represents A2. The intercept represents A0.
After training the model, you can predict the value for Y for any value of X1, X2 as follows.
from sklearn import linear_model
import numpy as np

X1 = np.array([1, 2, 3, 4, 5, 6, 7, 8, 9, 10])
X2 = np.array([5, 7, 7, 8, 9, 9, 10, 11, 12, 13])
Y = [5, 7, 6, 9, 11, 12, 12, 13, 14, 16]
X = list(zip(X1, X2))
lm = linear_model.LinearRegression()
lm.fit(X, Y)  # fitting the model
Z = [(1, 3), (1, 5), (4, 9), (4, 8)]
print("The input values are:", Z)
output = lm.predict(Z)
print("The predicted values are:", output)
Output:
The input values are: [(1, 3), (1, 5), (4, 9), (4, 8)]
The predicted values are: [3.8728972  4.97570093 9.35700935 8.80560748]

Aditya Raj is a highly skilled technical professional with a background in IT and business, holding an Integrated B.Tech (IT) and MBA (IT) from the Indian Institute of Information Technology Allahabad. With a solid foundation in data analytics, programming languages (C, Java, Python), and software environments, Aditya has excelled in various roles. He has significant experience as a Technical Content Writer for Python on multiple platforms and has interned in data analytics at Apollo Clinics. His projects demonstrate a keen interest in cutting-edge technology and problem-solving, showcasing his proficiency in areas like data mining and software development. Aditya's achievements include securing a top position in a project demonstration competition and gaining certifications in Python, SQL, and digital marketing fundamentals.
GitHub