Python 中的线性回归
在本文中,我们将讨论线性回归,并了解如何使用线性回归来预测结果。我们还将在 Python 中实现简单的线性回归和多元回归。
什么是回归
回归是识别自变量和因变量之间关系的过程。它用于预测房价、员工工资和其他预测应用。
如果我们要预测房价,自变量可能包括房屋的年龄、卧室数量、与中心城市位置(如机场、市场等)的距离。这里,房屋的价格将取决于这些自变量。因此,房子的价格是一个因变量。
同样,如果我们要预测员工的工资,自变量可能是他们的工作年限、教育水平、居住地的生活成本等。这里,因变量是员工的工资。
通过回归,我们尝试建立一个数学模型来描述自变量如何影响因变量。当提供自变量的值时,数学模型应该以最小的误差预测因变量。
什么是线性回归
在线性回归中,假设自变量和因变量是线性相关的。
假设给定 N 个自变量,如下所示。
$$
X=( X_1, X_2, X_3, X_4, X_5, X_6, X_7……, X_N)
$$
现在,我们需要找到如下等式的线性关系。
$$
F(X)= A_0+A_1X_1+A_2X_2+ A_3X_3+ A_4X_4+ A_5X_5+ A_6X_6+ A_7X_7+………..+A_NX_N
$$
这里,
- 我们必须使用线性回归来识别常数
Ai,以便在给定自变量时以最小误差预测因变量F(X)。 - 常数 Ai 称为回归系数的预测权重或估计量。
- F(X) 称为回归的预测响应或估计响应。对于给定的
X=( X1, X2, X3, X4, X5, X6, X7……, XN),F(X)应评估为尽可能接近实际因变量 Y 的值对于给定的自变量 X。 - 为了计算函数 F(X) 的计算结果为 Y,我们通常最小化给定 X 值的 F(X) 和 Y 之差的均方根。
Python 中简单线性回归的实现
简单回归中只有一个自变量和一个因变量。因此,预测的响应可以写成如下。
$$
F(X)= A_0+ A_{1X}
$$
为了在 Python 中实现简单的线性回归,我们需要一些 X 的实际值及其对应的 Y 值。使用这些值,我们可以通过数学方式或使用 Python 中提供的函数计算预测的权重 A0 和 A1。
假设我们以数组的形式给出了十个 X 值,如下所示。
X = [1, 2, 3, 4, 5, 6, 7, 8, 9, 10]
此外,相应的 Y 值如下给出。
Y = [2, 4, 3, 6, 8, 9, 9, 10, 11, 13]
为了找到回归方程 F(X),我们可以使用 scikit-learn 机器学习库中的 linear_model 模块。你可以通过在机器的命令提示符下执行以下命令来安装 scikit-learn 库。
pip3 install scikit-learn
scikit-learn 库的 linear_model 模块为我们提供了 LinearRegression() 方法,我们可以使用它来查找预测的响应。LinearRegression() 方法在执行时返回一个线性模型。我们可以训练这个线性模型来找到 F(X)。为此,我们使用 fit() 方法。
fit() 方法在线性模型上调用时,接受自变量数组 X 作为其第一个参数,将因变量数组 Y 作为其第二个输入参数。执行后,线性模型的参数被调整为模型代表 F(X)。你可以分别使用 intercept_ 和 coef_ 属性找到 A0 和 A1 的值,如下所示。
from sklearn import linear_model
import numpy as np

X = np.array([1, 2, 3, 4, 5, 6, 7, 8, 9, 10]).reshape(-1, 1)
Y = [2, 4, 3, 6, 8, 9, 9, 10, 11, 13]
lm = linear_model.LinearRegression()
lm.fit(X, Y)  # fitting the model
print("The coefficient is:", lm.coef_)
print("The intercept is:", lm.intercept_)
输出:
The coefficient is: [1.16969697]
The intercept is: 1.0666666666666664
在这里,可以看到系数值 A1 为 1.16969697,截距值 A0 为 1.0666666666666664。
实现线性回归模型后,你可以使用 predict() 方法预测任何 X 的 Y 值。在模型上调用时,predict() 方法将自变量 X 作为输入参数并返回因变量 Y 的预测值,如下例所示。
from sklearn import linear_model
import numpy as np

X = np.array([1, 2, 3, 4, 5, 6, 7, 8, 9, 10]).reshape(-1, 1)
Y = [2, 4, 3, 6, 8, 9, 9, 10, 11, 13]
lm = linear_model.LinearRegression()
lm.fit(X, Y)  # fitting the model
Z = np.array([1, 5, 15, 56, 27]).reshape(-1, 1)
print("The input values are:", Z)
output = lm.predict(Z)
print("The predicted values are:", output)
输出:
The input values are: [[ 1]
 [ 5]
 [15]
 [56]
 [27]]
The predicted values are: [ 2.23636364  6.91515152 18.61212121 66.56969697 32.64848485]
在这里,你可以看到我们为 predict() 方法提供了不同的 X 值,并且它为每个输入值返回了相应的预测值。
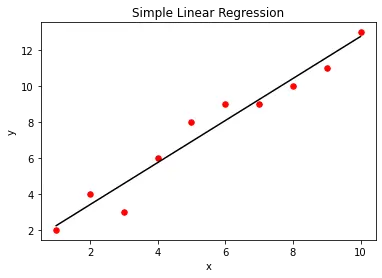
我们可以使用 matplotlib 库函数可视化简单的线性回归模型。为此,我们首先创建作为输入提供的实际 X 和 Y 值的散点图。创建线性回归模型后,我们将使用 predict() 方法绘制回归模型的输出与 X 的关系。这将为我们提供一条表示回归模型的直线,如下所示。
from sklearn import linear_model
import numpy as np
import matplotlib.pyplot as plt

X = np.array([1, 2, 3, 4, 5, 6, 7, 8, 9, 10]).reshape(-1, 1)
Y = [2, 4, 3, 6, 8, 9, 9, 10, 11, 13]
lm = linear_model.LinearRegression()
lm.fit(X, Y)
plt.scatter(X, Y, color="r", marker="o", s=30)
y_pred = lm.predict(X)
plt.plot(X, y_pred, color="k")
plt.xlabel("x")
plt.ylabel("y")
plt.title("Simple Linear Regression")
plt.show()
输出:
Python 中多重回归的实现
在多元回归中,我们有不止一个自变量。例如,假设有两个自变量 X1 和 X2,它们的因变量 Y 给出如下。
X1 = [1, 2, 3, 4, 5, 6, 7, 8, 9, 10]
X2 = [5, 7, 7, 8, 9, 9, 10, 11, 12, 13]
Y = [5, 7, 6, 9, 11, 12, 12, 13, 14, 16]
这里 X1、X2 和 Y 中的每个第 i 个值形成一个三元组,其中数组 Y 的第 i 个元素由数组 X1 的第 i 个元素和数组 X2 的第 i 个元素确定。
为了在 Python 中实现多元回归,我们将从 X1 和 X2 创建一个数组 X,如下所示。
X1 = [1, 2, 3, 4, 5, 6, 7, 8, 9, 10]
X2 = [5, 7, 7, 8, 9, 9, 10, 11, 12, 13]
X = [
    (1, 5),
    (2, 7),
    (3, 7),
    (4, 8),
    (5, 9),
    (6, 9),
    (7, 10),
    (8, 11),
    (9, 12),
    (10, 13),
]
要从 X1 和 X2 创建 X,我们将使用 zip() 方法。zip() 方法将不同的可迭代对象作为输入,并返回一个包含成对元素的迭代器。如下所示,我们可以使用 list() 构造函数将迭代器转换为列表。
X1 = [1, 2, 3, 4, 5, 6, 7, 8, 9, 10]
X2 = [5, 7, 7, 8, 9, 9, 10, 11, 12, 13]
print("X1:", X1)
print("X2:", X2)
X = list(zip(X1, X2))
print("X:", X)
输出:
X1: [1, 2, 3, 4, 5, 6, 7, 8, 9, 10]
X2: [5, 7, 7, 8, 9, 9, 10, 11, 12, 13]
X: [(1, 5), (2, 7), (3, 7), (4, 8), (5, 9), (6, 9), (7, 10), (8, 11), (9, 12), (10, 13)]
得到 X 后,我们需要找到 F(X)= A0+A1X1+A2X2。
为此,我们可以将特征矩阵 X 和因变量数组 Y 传递给 fit() 方法。执行时,fit() 方法会调整常数 A0、A1 和 A2,使模型代表多元回归模型 F(X)。你可以使用 coef_ 属性找到值 A1 和 A2,使用 intercept_ 属性找到值 A0,如下所示。
from sklearn import linear_model
import numpy as np

X1 = np.array([1, 2, 3, 4, 5, 6, 7, 8, 9, 10])
X2 = np.array([5, 7, 7, 8, 9, 9, 10, 11, 12, 13])
Y = [5, 7, 6, 9, 11, 12, 12, 13, 14, 16]
X = list(zip(X1, X2))
lm = linear_model.LinearRegression()
lm.fit(X, Y)  # fitting the model
print("The coefficient is:", lm.coef_)
print("The intercept is:", lm.intercept_)
输出:
The coefficient is: [0.72523364 0.55140187]
The intercept is: 1.4934579439252396
在这里,你可以看到系数是一个数组。数组的第一个元素代表 A1,而数组的第二个元素代表 A2。截距代表 A0
训练模型后,你可以预测 X1、X2 的任何值的 Y 值,如下所示。
from sklearn import linear_model
import numpy as np

X1 = np.array([1, 2, 3, 4, 5, 6, 7, 8, 9, 10])
X2 = np.array([5, 7, 7, 8, 9, 9, 10, 11, 12, 13])
Y = [5, 7, 6, 9, 11, 12, 12, 13, 14, 16]
X = list(zip(X1, X2))
lm = linear_model.LinearRegression()
lm.fit(X, Y)  # fitting the model
Z = [(1, 3), (1, 5), (4, 9), (4, 8)]
print("The input values are:", Z)
output = lm.predict(Z)
print("The predicted values are:", output)
输出:
The input values are: [(1, 3), (1, 5), (4, 9), (4, 8)]
The predicted values are: [3.8728972  4.97570093 9.35700935 8.80560748]

Aditya Raj is a highly skilled technical professional with a background in IT and business, holding an Integrated B.Tech (IT) and MBA (IT) from the Indian Institute of Information Technology Allahabad. With a solid foundation in data analytics, programming languages (C, Java, Python), and software environments, Aditya has excelled in various roles. He has significant experience as a Technical Content Writer for Python on multiple platforms and has interned in data analytics at Apollo Clinics. His projects demonstrate a keen interest in cutting-edge technology and problem-solving, showcasing his proficiency in areas like data mining and software development. Aditya's achievements include securing a top position in a project demonstration competition and gaining certifications in Python, SQL, and digital marketing fundamentals.
GitHub