How to Normalize a Column in Pandas Dataframe
- Data Normalization in Pandas
-
Normalize Pandas Dataframe With the
meanNormalization -
Normalize Pandas Dataframe With the
min-maxNormalization -
Normalize Pandas Dataframe With the
quantileNormalization

Standardization or normalization of data is the initial step of Feature Engineering. Normalization of the columns will involve bringing the values of the columns to a common scale, mostly done for columns with varied ranges. In Pandas, the columns of Dataframes can be normalized by a variety of functions.
This article will help you practice these functions and help you apply the functions in the right situations.
Data Normalization in Pandas
There are two most widely used data normalization methods.
- Mean Normalization
- Min-Max Normalization
- Quantile Normalization
There aren’t any specific methods available in Pandas to perform data normalization. We will be explaining what these normalizations are and how it can be implemented using native Pandas and a bit of touch from the native python functions.
We will use the following snippet everywhere to create a dataframe with random elements as below.
import pandas as pd
import numpy as np

np.random.seed(0)

df = pd.DataFrame(np.random.randint(-100, 100, size=(20, 4)), columns=list("ABCD"))
print(df)
It will return a similar dataframe as given below.
     A   B   C   D
0   72 -53  17  92
1  -33  95   3 -91
2  -79 -64 -13 -30
3  -12  40 -42  93
4  -61 -13  74 -12
5  -19  65 -75 -23
6  -28 -91  48  15
7   97 -21  75  92
8  -18  -1  77 -71
9   47  47  42  67
10 -68  93 -91  85
11  27 -68 -69  51
12  63  14  83 -72
13 -66  28  28  64
14 -47  33 -62 -83
15 -21  32   5 -58
16  86 -69  20 -99
17 -35  69 -43 -65
18   2  19 -89  74
19 -18  -9  28  42

[20 rows x 4 columns]
Normalize Pandas Dataframe With the mean Normalization
The mean normalization is one of the easiest ways to normalize the Dataframes of varied ranges. The normalization is done by subtracting the mean and dividing by the standard deviation for all elements of the dataframe.
import pandas as pd
import numpy as np

np.random.seed(0)

df = pd.DataFrame(np.random.randint(-100, 100, size=(20, 4)), columns=list("ABCD"))


def mean_norm(df_input):
    return df_input.apply(lambda x: (x - x.mean()) / x.std(), axis=0)


df_mean_norm = mean_norm(df)
print(df_mean_norm)
Output:
           A         B         C         D
0   1.452954 -1.090261  0.278088  1.247208
1  -0.514295  1.585670  0.037765 -1.333223
2  -1.376137 -1.289148 -0.236890 -0.473079
3  -0.120845  0.591236 -0.734701  1.261309
4  -1.038895 -0.367037  1.256545 -0.219266
5  -0.251995  1.043252 -1.301176 -0.374374
6  -0.420617 -1.777325  0.810231  0.161453
7   1.921346 -0.511681  1.273711  1.247208
8  -0.233260 -0.150069  1.308043 -1.051208
9   0.984561  0.717801  0.707236  0.894690
10 -1.170045  1.549509 -1.575831  1.148503
11  0.609847 -1.361470 -1.198181  0.669079
12  1.284333  0.121140  1.411038 -1.065309
13 -1.132573  0.374269  0.466913  0.852388
14 -0.776595  0.464672 -1.078020 -1.220417
15 -0.289467  0.446591  0.072097 -0.867899
16  1.715254 -1.379551  0.329586 -1.446028
17 -0.551766  1.115574 -0.751867 -0.966604
18  0.141455  0.211543 -1.541499  0.993395
19 -0.233260 -0.294714  0.466913  0.542172
If you are using a Jupyter notebook, both the Dataframes can be visualized using Matplotlib, as shown in the code below.
# %matplotlib inline
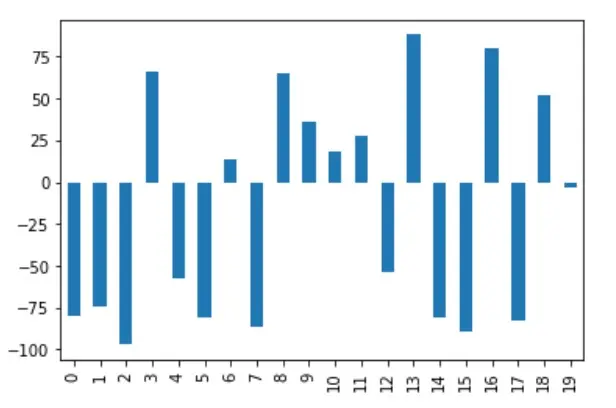
df["A"].plot(kind="bar")
By selecting the column A of the dataframe before normalization and visualizing a bar chart out of it, notice that the y-axis contains values in the range -100 to 100.
# %matplotlib inline
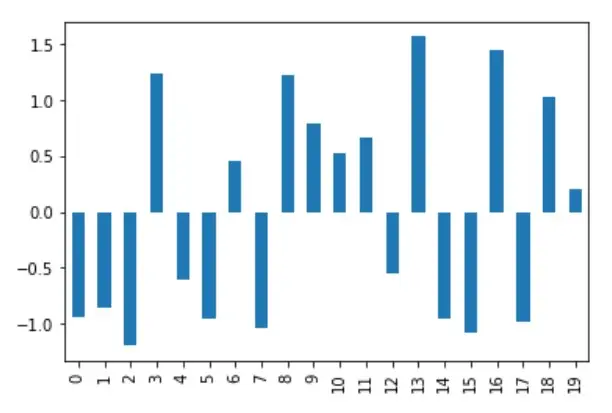
df_mean_norm["A"].plot(kind="bar")
The below figure shows the data post normalization; when the same column is visualized, the y-axis lies in the range -1.5 to +1.5.
Normalize Pandas Dataframe With the min-max Normalization
This is one of the widely used methods for normalization. The normalization output subtracts the minimum value of a dataframe and divides it by the difference between the highest and lowest value of the corresponding column.
import pandas as pd
import numpy as np

np.random.seed(0)

df = pd.DataFrame(np.random.randint(-100, 100, size=(20, 4)), columns=list("ABCD"))


def minmax_norm(df_input):
    return (df - df.min()) / (df.max() - df.min())


df_minmax_norm = minmax_norm(df)

print(df_minmax_norm)
Output:
           A         B         C         D
0   0.857955  0.204301  0.620690  0.994792
1   0.261364  1.000000  0.540230  0.041667
2   0.000000  0.145161  0.448276  0.359375
3   0.380682  0.704301  0.281609  1.000000
4   0.102273  0.419355  0.948276  0.453125
5   0.340909  0.838710  0.091954  0.395833
6   0.289773  0.000000  0.798851  0.593750
7   1.000000  0.376344  0.954023  0.994792
8   0.346591  0.483871  0.965517  0.145833
9   0.715909  0.741935  0.764368  0.864583
10  0.062500  0.989247  0.000000  0.958333
11  0.602273  0.123656  0.126437  0.781250
12  0.806818  0.564516  1.000000  0.140625
13  0.073864  0.639785  0.683908  0.848958
14  0.181818  0.666667  0.166667  0.083333
15  0.329545  0.661290  0.551724  0.213542
16  0.937500  0.118280  0.637931  0.000000
17  0.250000  0.860215  0.275862  0.177083
18  0.460227  0.591398  0.011494  0.901042
19  0.346591  0.440860  0.683908  0.734375
In the above output, we can infer that each column’s least value gets transformed into 0, and the maximum value in each column gets transformed into 1.
The column A for this normalization is visualized, as shown below.
# %matplotlib inline
df_minmax_norm["A"].plot(kind="bar")
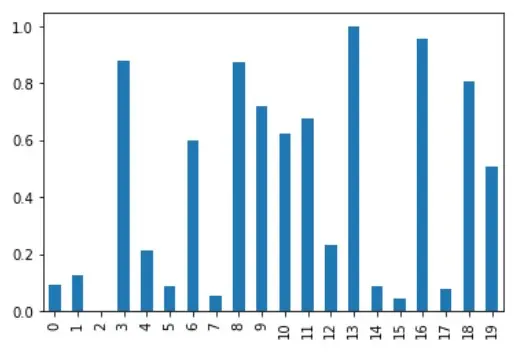
Although this holds good for close-ranged Dataframes, MinMax normalization may not be suitable for Dataframes with many outliers.
Normalize Pandas Dataframe With the quantile Normalization
Quantile normalization is used in the case of high dimensional data analyses. It observes and assumes that the statistical distribution of every column is one and the same. Quantile normalization consists of the following steps:
- Order values within each column (Ranking)
- Average across each row and replace the value of each element in the row with the average
- Re-order values to the original order as initially.
import numpy as np
import pandas as pd

np.random.seed(0)

df = pd.DataFrame(np.random.randint(-100, 100, size=(20, 4)), columns=list("ABCD"))


def quantile_norm(df_input):
    sorted_df = pd.DataFrame(
        np.sort(df_input.values, axis=0), index=df_input.index, columns=df_input.columns
    )
    mean_df = sorted_df.mean(axis=1)
    mean_df.index = np.arange(1, len(mean_df) + 1)
    quantile_df = df_input.rank(method="min").stack().astype(int).map(mean_df).unstack()
    return quantile_df


df_quantile_norm = quantile_norm(df)

print(df_quantile_norm)
Output:
        A      B      C      D
0   77.00 -58.25   8.25  77.00
1  -36.50  92.00 -10.50 -79.25
2  -90.00 -66.50 -20.00 -20.00
3   24.75  44.00 -36.50  92.00
4  -66.50 -36.50  71.75  -3.00
5   -3.00  71.75 -73.00 -10.50
6  -20.00 -90.00  54.00   8.25
7   92.00 -41.00  77.00  77.00
8    8.25 -10.50  87.00 -58.25
9   54.00  54.00  44.00  44.00
10 -79.25  87.00 -90.00  71.75
11  44.00 -73.00 -66.50  24.75
12  71.75  -3.00  92.00 -66.50
13 -73.00  18.00  24.75  31.75
14 -58.25  31.75 -58.25 -73.00
15 -10.50  24.75  -3.00 -36.50
16  87.00 -79.25  18.00 -90.00
17 -41.00  77.00 -41.00 -41.00
18  31.75   8.25 -79.25  54.00
19   8.25 -20.00  24.75  18.00
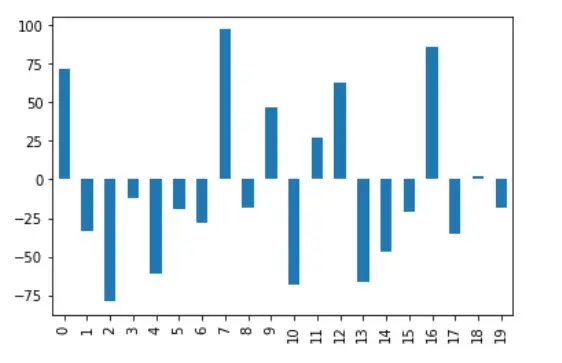
The output for the quantile normalization can be visualized for column A as shown below.
Related Article - Pandas DataFrame
- How to Get Pandas DataFrame Column Headers as a List
- How to Delete Pandas DataFrame Column
- How to Convert Pandas Column to Datetime
- How to Convert a Float to an Integer in Pandas DataFrame
- How to Sort Pandas DataFrame by One Column's Values
- How to Get the Aggregate of Pandas Group-By and Sum