How to Draw a Graph in PHP
- Set Up Your Environment
-
Plot a Bar Chart Using
pChartin PHP -
Plot a Spline Chart Using
pChartin PHP - Plot a Histogram in PHP From the MySQL Database
This article explains how you can create a graph using pChart in PHP. The first is a bar chart, the second is a spline chart, and the last is a histogram from MySQL.
Set Up Your Environment
The first thing you’ll need before using pChart is an installation of PHP5. You can get PHP5 as part of XAMPP 5.5.28 from SourceForge.
When you have XAMPP 5.5.28, download pChart from their official website. Afterward, extract pChart into the htdocs folder of XAMPP 5.5.28.
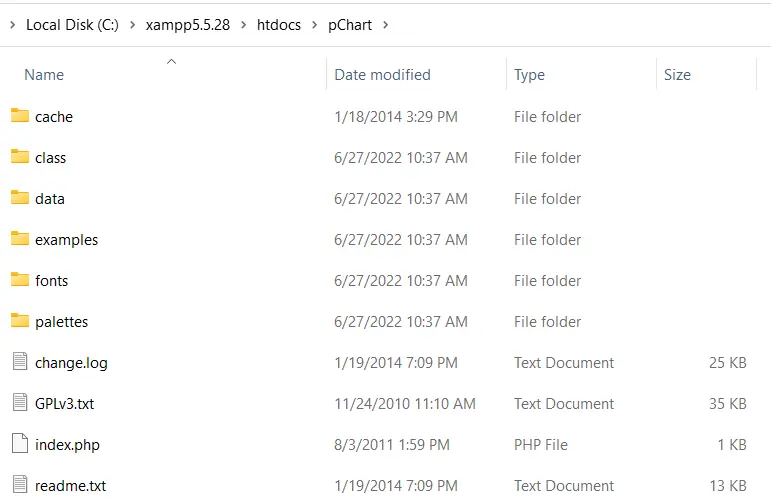
Open the pChart folder, and its structure should be like the following image:
Note:
- The
classfolder contains the class definition we’ll use. - The
fontsfolder contains the font files we can use in our chart.
After completing the pChart setup, you can now start plotting.
Plot a Bar Chart Using pChart in PHP
The PHP code to plot the bar chart using pChart must include three files from the class folder. These files are:
pData.class.phppImage.class.phppDraw.class.php
Of these files, pData.class.php allows you to load the data you’ll use in the chart. You’ll need pDraw.class.php to draw the chart.
Next, the pImage.class.php will let you render the chart in your web browser. You’ll have to include these files using PHP required_once().
You can include them using relative paths or define a PCHART_PATH constant. Then with set_include_path(), you can use a short directory name for the pChart classes.
With that said, we can create a bar chart with pChart using the following steps:
-
Define the
PCHART_PATHconstant. -
Use
set_include_path()for short directory name of thepChartclasses. -
Include the
pChartclasses usingrequired_once(). -
Create a new
pDataobject. -
Create your data or import it.
-
Add the data to the
pDataobject using itsaddPointsmethod. -
Create an image for the chart using an object of
pImage. -
Set the font of the chart.
-
Set the graph area using the
setGraphAreamethod ofpData. -
Draw a scale and the bar chart using
drawScaleanddrawBarChartmethods ofpData. -
Send header information to tell the browser you are sending an image.
-
Render the image using the
Rendermethod ofpData. Ensure you passnullto theRendermethod.
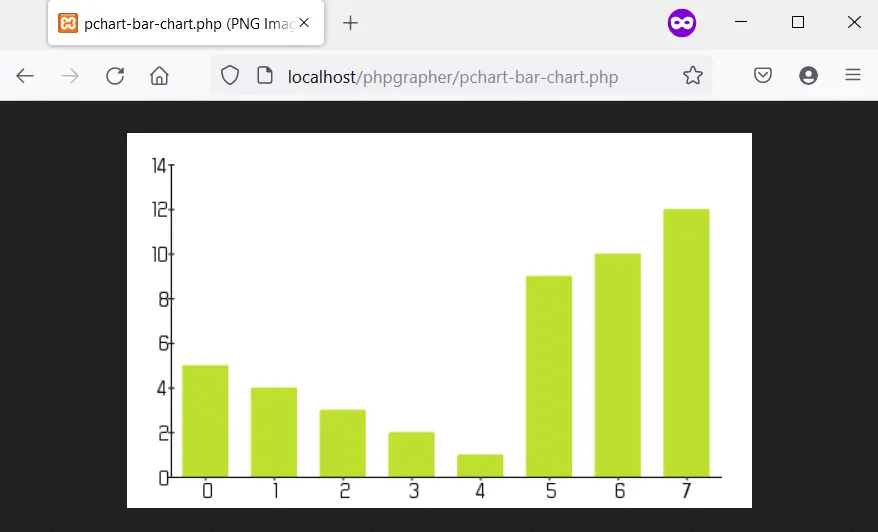
The following is the implementation of these steps. What follows is the output image in Firefox 101.0.
<?php
    // The definition of the PCHART_PATH assumes
    // you have pChart one directory above your
    // current working folder.
    define("PCHART_PATH", "../pChart");
    set_include_path(get_include_path() . PATH_SEPARATOR . PCHART_PATH);
    // Since we have defined the path, and used
    // the get_include_path() function, we can
    // reference the class folder without writing
    // its full path.
    require_once "class/pDraw.class.php";
    require_once "class/pImage.class.php";
    require_once "class/pData.class.php";
    // Create the pChart Object
    $pchart_data = new pData();
    // Some sample data that we'll use to plot
    // the bar chart.
    $sample_data_set = [5, 4, 3, 2, 1, 9, 10, 12];
    $pchart_data->addPoints($sample_data_set);
    // Create the pChart Image. The first two argument
    // to the pImage object are the width and height
    // of the rendered chart.
    $pchart_image = new pImage(500, 300, $pchart_data);
    // Set the font.
    $pchart_image->setFontProperties(
    ["FontName" => PCHART_PATH . "/fonts/Forgotte.ttf",
    "FontSize" => 16]
    );
    // Define the graph area. The first two arguments
    // are the x-coordinates. While the last two are
    // the y-coordinates.
    $pchart_image->setGraphArea(35, 25, 475, 275);
    $pchart_image->drawScale();
    $pchart_image->drawBarChart();
    // Render the chart as a PNG image
    header("Content-Type: image/png");
    $pchart_image->Render(null);
?>
Output:
Plot a Spline Chart Using pChart in PHP
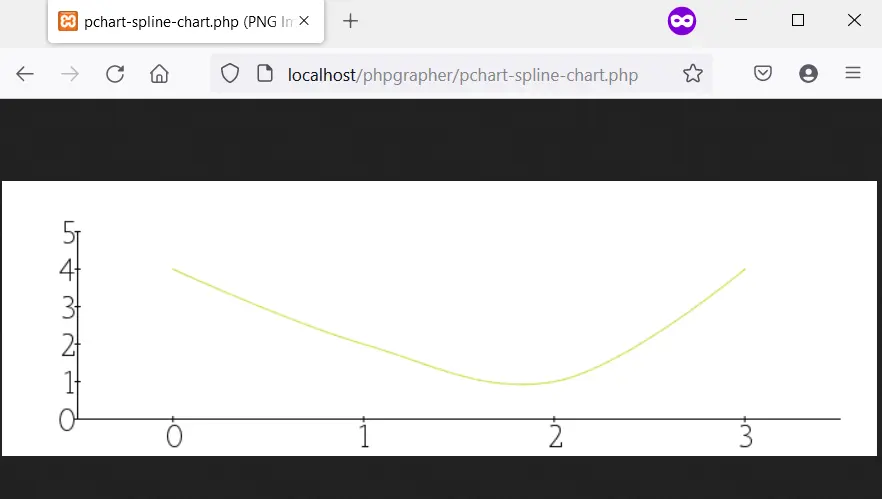
Plotting a spline chart follows the same process as we did for the bar chart, except that you draw a spline chart using the drawSplineChart method. Also, you can choose not to send the chart as an image.
Instead, you can opt for the Stroke method of pData to render the chart in your web browser.
The following code draws a spline chart using pChart. What’s more, we are using the MankSans.ttf font from the fonts directory.
<?php
    // The definition of the PCHART_PATH assumes
    // you have pChart one directory above your
    // current working folder.
    define("PCHART_PATH", "../pChart");
    set_include_path(get_include_path() . PATH_SEPARATOR . PCHART_PATH);
    // Since we have defined the path, and used
    // the get_include_path() function, we can
    // reference the class folder without writing
    // its full path.
    require_once "class/pDraw.class.php";
    require_once "class/pImage.class.php";
    require_once "class/pData.class.php";
    // Create the pChart Object
    $pchart_data = new pData();
    // Some sample data that we'll use to plot
    // the spline chart.
    $pchart_data->addPoints([4,2,1,4]);
    // Create the pChart Image. The first two argument
    // to the pImage object are the width and height
    // of the rendered chart.
    $pchart_image = new pImage(700, 220, $pchart_data);
    // Set the font.
    $pchart_image->setFontProperties(
        ["FontName" => PCHART_PATH . "/fonts/MankSans.ttf",
        "FontSize"=> 18]
    );
    // Define the graph area. The first two arguments
    // are the x-coordinates. While the last two are
    // the y-coordinates.
    $pchart_image->setGraphArea(60, 40, 670, 190);
    $pchart_image->drawScale();
    $pchart_image->drawSplineChart();
    // Draw the chart as a stroke.
    $pchart_image->Stroke();
?>
Output:
Plot a Histogram in PHP From the MySQL Database
Plotting a histogram follows similar steps to that of a bar chart and spline chart. But, there are some differences worth pointing out.
First, the data for the histogram will come from MySQL. This means you should have a database with some sample data.
Second, you’ll use the table column names as the axis on the histogram. For this, you’ll use some pData methods like setAbscissa, setSeriesOnAxis, and setAxisName.
Now, create a database called weather_measurements, then create a table using the following:
CREATE TABLE measures (
    timestamp INT NOT NULL DEFAULT '0',
    temperature INT NOT NULL,
    humidity INT NOT NULL
)
Insert sample data into the measures table using the following:
INSERT INTO measures (timestamp, temperature, humidity) VALUES (UNIX_TIMESTAMP(), 20, 50);
INSERT INTO measures (timestamp, temperature, humidity) VALUES (UNIX_TIMESTAMP(), 18, 44);
INSERT INTO measures (timestamp, temperature, humidity) VALUES (UNIX_TIMESTAMP(), 19, 70);
Ensure the sample data are in the database, then create the histogram using the following:
<?php
    // The definition of the PCHART_PATH assumes
    // you have pChart one directory above your
    // current working folder.
    define("PCHART_PATH", "../pChart");
    set_include_path(get_include_path() . PATH_SEPARATOR . PCHART_PATH);
    // Since we have defined the path, and used
    // the get_include_path() function, we can
    // reference the class folder without writing
    // its full path.
    require_once "class/pDraw.class.php";
    require_once "class/pImage.class.php";
    require_once "class/pData.class.php";
    // Create the pChart Object
    $pchart_data = new pData();

    // Connect to MySQL
    $connect_to_mysql = new mysqli("localhost", "root", "", "weather_measurements");

    // query the database and get the result
    $query_the_table = "SELECT * FROM measures";
    $mysql_result  = mysqli_query($connect_to_mysql, $query_the_table);
    // Declare the variables for the database
    // records as empty strings. Later, we'll
    // turn them into arrays for better performance
    $timestamp = ""; $temperature = ""; $humidity = "";
    while($row = mysqli_fetch_array($mysql_result, MYSQLI_ASSOC)) {
        $timestamp[]   = $row["timestamp"];
        $temperature[] = $row["temperature"];
        $humidity[]    = $row["humidity"];
    }

    $pchart_data->addPoints($timestamp,"Timestamp");
    $pchart_data->addPoints($temperature,"Temperature");
    $pchart_data->addPoints($humidity,"Humidity");
    // Put the table column on the appropriate axis
    $pchart_data->setAbscissa("Timestamp");
    $pchart_data->setSerieOnAxis("Humidity", 1);
    $pchart_data->setXAxisName("Time");
    $pchart_data->setXAxisDisplay(AXIS_FORMAT_TIME,"H:i");
    // Dedicate the first and second axis to
    // Temperature and Humidity.
    $pchart_data->setAxisName(0, "Temperature");
    $pchart_data->setAxisUnit(0, "°C");
    $pchart_data->setAxisName(1, "Humidity");
    $pchart_data->setAxisUnit(0, "%");
    // Create the pChart Image. The first two argument
    // to the pImage object are the width and height
    // of the rendered chart.
    $pchart_image = new pImage(500, 300, $pchart_data);
    // Set the font.
    $pchart_image->setFontProperties(
        ["FontName" => PCHART_PATH . "/fonts/verdana.ttf",
        "FontSize"=> 11]
    );
    // Set the graph area.
    $pchart_image->setGraphArea(55,25, 475,275);
    $pchart_image->drawScale();
    $pchart_image->drawBarChart();
    // Draw the chart as a stroke.
    $pchart_image->Stroke();
?>
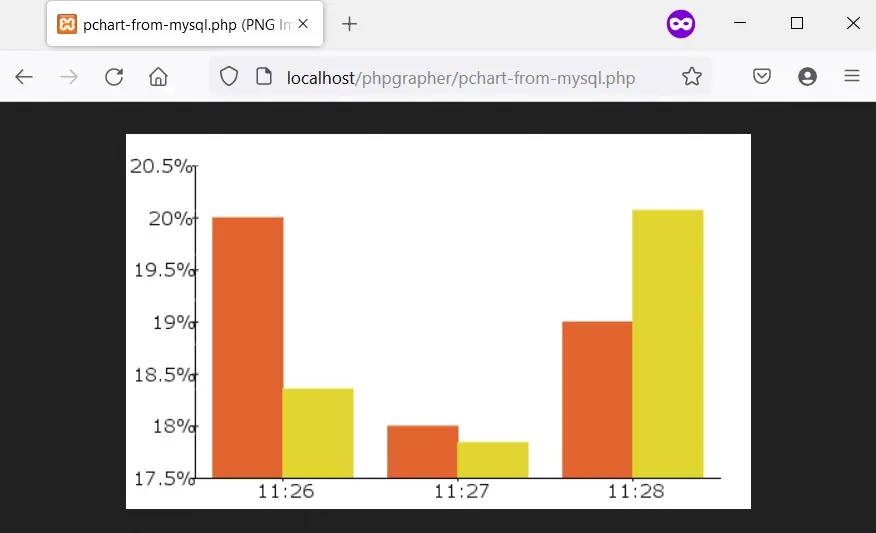
Output (your time will vary):

Habdul Hazeez is a technical writer with amazing research skills. He can connect the dots, and make sense of data that are scattered across different media.
LinkedIn