PHP로 그래프 그리기
이 기사에서는 PHP에서 pChart를 사용하여 그래프를 만드는 방법을 설명합니다. 첫 번째는 막대 차트, 두 번째는 스플라인 차트, 마지막은 MySQL의 히스토그램입니다.
환경 설정
pChart를 사용하기 전에 가장 먼저 필요한 것은 PHP5를 설치하는 것입니다. SourceForge에서 XAMPP 5.5.28의 일부로 PHP5를 얻을 수 있습니다.
XAMPP 5.5.28이 있는 경우 공식 웹사이트에서 pChart를 다운로드하십시오. 그런 다음 XAMPP 5.5.28의 htdocs 폴더에 pChart를 추출합니다.
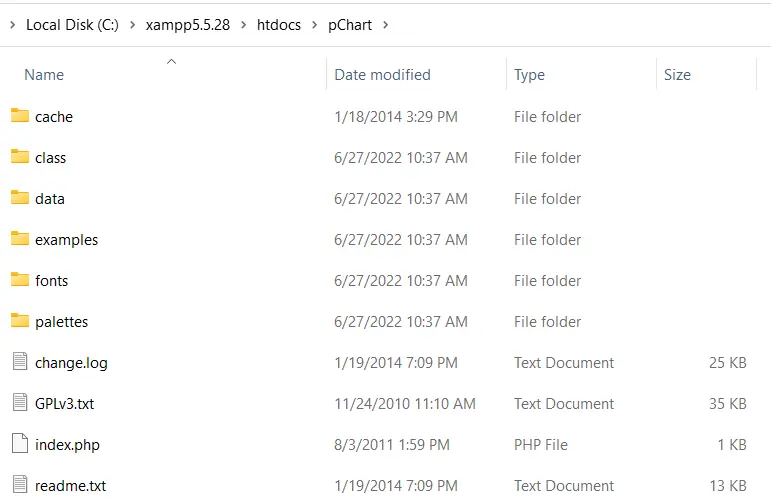
pChart 폴더를 열면 구조가 다음 이미지와 같아야 합니다.
메모:
class폴더에는 우리가 사용할 클래스 정의가 들어 있습니다.fonts폴더에는 차트에서 사용할 수 있는 글꼴 파일이 있습니다.
pChart 설정을 완료하면 이제 플로팅을 시작할 수 있습니다.
PHP에서 pChart를 사용하여 막대 차트 그리기
pChart를 사용하여 막대 차트를 그리는 PHP 코드에는 class 폴더에 있는 세 개의 파일이 포함되어야 합니다. 이러한 파일은 다음과 같습니다.
pData.class.phppImage.class.phppDraw.class.php
이 파일 중 pData.class.php를 사용하면 차트에서 사용할 데이터를 로드할 수 있습니다. 차트를 그리려면 pDraw.class.php가 필요합니다.
다음으로 pImage.class.php를 사용하면 웹 브라우저에서 차트를 렌더링할 수 있습니다. PHP required_once()를 사용하여 이러한 파일을 포함해야 합니다.
상대 경로를 사용하여 포함하거나 PCHART_PATH 상수를 정의할 수 있습니다. 그런 다음 set_include_path()를 사용하여 pChart 클래스에 대한 짧은 디렉토리 이름을 사용할 수 있습니다.
즉, 다음 단계를 사용하여 pChart를 사용하여 막대 차트를 만들 수 있습니다.
-
PCHART_PATH상수를 정의합니다. -
pChart클래스의 짧은 디렉토리 이름에set_include_path()를 사용하십시오. -
required_once()를 사용하여pChart클래스를 포함합니다. -
새
pData개체를 만듭니다. -
데이터를 생성하거나 가져옵니다.
-
addPoints메서드를 사용하여pData개체에 데이터를 추가합니다. -
pImage의 개체를 사용하여 차트에 대한 이미지를 만듭니다. -
차트의 글꼴을 설정합니다.
-
pData의setGraphArea방법을 사용하여 그래프 영역을 설정합니다. -
pData의drawScale및drawBarChart방법을 사용하여 눈금과 막대 차트를 그립니다. -
헤더 정보를 보내 브라우저에 이미지를 보내고 있음을 알립니다.
-
pData의Render방법을 사용하여 이미지를 렌더링합니다.null을Render메소드에 전달했는지 확인하십시오.
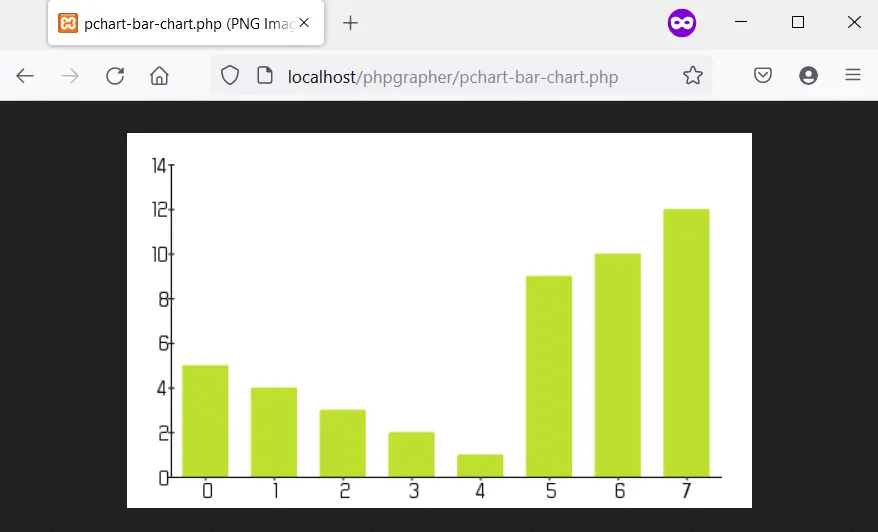
다음은 이러한 단계의 구현입니다. 다음은 Firefox 101.0의 출력 이미지입니다.
<?php
    // The definition of the PCHART_PATH assumes
    // you have pChart one directory above your
    // current working folder.
    define("PCHART_PATH", "../pChart");
    set_include_path(get_include_path() . PATH_SEPARATOR . PCHART_PATH);
    // Since we have defined the path, and used
    // the get_include_path() function, we can
    // reference the class folder without writing
    // its full path.
    require_once "class/pDraw.class.php";
    require_once "class/pImage.class.php";
    require_once "class/pData.class.php";
    // Create the pChart Object
    $pchart_data = new pData();
    // Some sample data that we'll use to plot
    // the bar chart.
    $sample_data_set = [5, 4, 3, 2, 1, 9, 10, 12];
    $pchart_data->addPoints($sample_data_set);
    // Create the pChart Image. The first two argument
    // to the pImage object are the width and height
    // of the rendered chart.
    $pchart_image = new pImage(500, 300, $pchart_data);
    // Set the font.
    $pchart_image->setFontProperties(
    ["FontName" => PCHART_PATH . "/fonts/Forgotte.ttf",
    "FontSize" => 16]
    );
    // Define the graph area. The first two arguments
    // are the x-coordinates. While the last two are
    // the y-coordinates.
    $pchart_image->setGraphArea(35, 25, 475, 275);
    $pchart_image->drawScale();
    $pchart_image->drawBarChart();
    // Render the chart as a PNG image
    header("Content-Type: image/png");
    $pchart_image->Render(null);
?>
출력:
PHP에서 pChart를 사용하여 스플라인 차트 그리기
스플라인 차트를 그리는 것은 drawSplineChart 방법을 사용하여 스플라인 차트를 그리는 것을 제외하고 막대 차트에 대해 수행한 것과 동일한 프로세스를 따릅니다. 또한 차트를 이미지로 보내지 않도록 선택할 수 있습니다.
대신 pData의 Stroke 방법을 선택하여 웹 브라우저에서 차트를 렌더링할 수 있습니다.
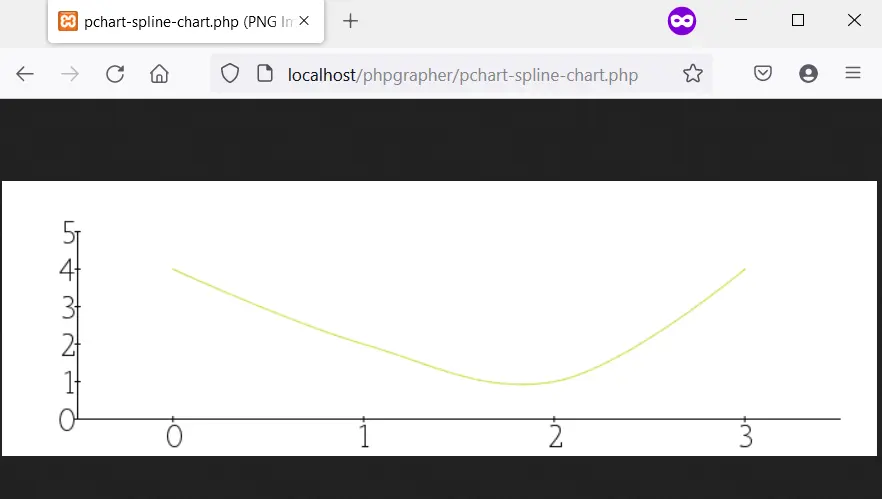
다음 코드는 pChart를 사용하여 스플라인 차트를 그립니다. 게다가 fonts 디렉토리에서 MankSans.ttf 글꼴을 사용하고 있습니다.
<?php
    // The definition of the PCHART_PATH assumes
    // you have pChart one directory above your
    // current working folder.
    define("PCHART_PATH", "../pChart");
    set_include_path(get_include_path() . PATH_SEPARATOR . PCHART_PATH);
    // Since we have defined the path, and used
    // the get_include_path() function, we can
    // reference the class folder without writing
    // its full path.
    require_once "class/pDraw.class.php";
    require_once "class/pImage.class.php";
    require_once "class/pData.class.php";
    // Create the pChart Object
    $pchart_data = new pData();
    // Some sample data that we'll use to plot
    // the spline chart.
    $pchart_data->addPoints([4,2,1,4]);
    // Create the pChart Image. The first two argument
    // to the pImage object are the width and height
    // of the rendered chart.
    $pchart_image = new pImage(700, 220, $pchart_data);
    // Set the font.
    $pchart_image->setFontProperties(
        ["FontName" => PCHART_PATH . "/fonts/MankSans.ttf",
        "FontSize"=> 18]
    );
    // Define the graph area. The first two arguments
    // are the x-coordinates. While the last two are
    // the y-coordinates.
    $pchart_image->setGraphArea(60, 40, 670, 190);
    $pchart_image->drawScale();
    $pchart_image->drawSplineChart();
    // Draw the chart as a stroke.
    $pchart_image->Stroke();
?>
출력:
MySQL 데이터베이스에서 PHP로 히스토그램 그리기
히스토그램 플로팅은 막대 차트 및 스플라인 차트와 유사한 단계를 따릅니다. 그러나 지적할 가치가 있는 몇 가지 차이점이 있습니다.
먼저 히스토그램의 데이터는 MySQL에서 가져옵니다. 이는 샘플 데이터가 있는 데이터베이스가 있어야 함을 의미합니다.
둘째, 테이블 열 이름을 히스토그램의 축으로 사용합니다. 이를 위해 setAbscissa, setSeriesOnAxis 및 setAxisName과 같은 pData 메서드를 사용합니다.
이제 weather_measurements라는 데이터베이스를 만들고 다음을 사용하여 테이블을 만듭니다.
CREATE TABLE measures (
    timestamp INT NOT NULL DEFAULT '0',
    temperature INT NOT NULL,
    humidity INT NOT NULL
)
다음을 사용하여 measures 테이블에 샘플 데이터를 삽입합니다.
INSERT INTO measures (timestamp, temperature, humidity) VALUES (UNIX_TIMESTAMP(), 20, 50);
INSERT INTO measures (timestamp, temperature, humidity) VALUES (UNIX_TIMESTAMP(), 18, 44);
INSERT INTO measures (timestamp, temperature, humidity) VALUES (UNIX_TIMESTAMP(), 19, 70);
샘플 데이터가 데이터베이스에 있는지 확인한 후 다음을 사용하여 히스토그램을 만듭니다.
<?php
    // The definition of the PCHART_PATH assumes
    // you have pChart one directory above your
    // current working folder.
    define("PCHART_PATH", "../pChart");
    set_include_path(get_include_path() . PATH_SEPARATOR . PCHART_PATH);
    // Since we have defined the path, and used
    // the get_include_path() function, we can
    // reference the class folder without writing
    // its full path.
    require_once "class/pDraw.class.php";
    require_once "class/pImage.class.php";
    require_once "class/pData.class.php";
    // Create the pChart Object
    $pchart_data = new pData();

    // Connect to MySQL
    $connect_to_mysql = new mysqli("localhost", "root", "", "weather_measurements");

    // query the database and get the result
    $query_the_table = "SELECT * FROM measures";
    $mysql_result  = mysqli_query($connect_to_mysql, $query_the_table);
    // Declare the variables for the database
    // records as empty strings. Later, we'll
    // turn them into arrays for better performance
    $timestamp = ""; $temperature = ""; $humidity = "";
    while($row = mysqli_fetch_array($mysql_result, MYSQLI_ASSOC)) {
        $timestamp[]   = $row["timestamp"];
        $temperature[] = $row["temperature"];
        $humidity[]    = $row["humidity"];
    }

    $pchart_data->addPoints($timestamp,"Timestamp");
    $pchart_data->addPoints($temperature,"Temperature");
    $pchart_data->addPoints($humidity,"Humidity");
    // Put the table column on the appropriate axis
    $pchart_data->setAbscissa("Timestamp");
    $pchart_data->setSerieOnAxis("Humidity", 1);
    $pchart_data->setXAxisName("Time");
    $pchart_data->setXAxisDisplay(AXIS_FORMAT_TIME,"H:i");
    // Dedicate the first and second axis to
    // Temperature and Humidity.
    $pchart_data->setAxisName(0, "Temperature");
    $pchart_data->setAxisUnit(0, "°C");
    $pchart_data->setAxisName(1, "Humidity");
    $pchart_data->setAxisUnit(0, "%");
    // Create the pChart Image. The first two argument
    // to the pImage object are the width and height
    // of the rendered chart.
    $pchart_image = new pImage(500, 300, $pchart_data);
    // Set the font.
    $pchart_image->setFontProperties(
        ["FontName" => PCHART_PATH . "/fonts/verdana.ttf",
        "FontSize"=> 11]
    );
    // Set the graph area.
    $pchart_image->setGraphArea(55,25, 475,275);
    $pchart_image->drawScale();
    $pchart_image->drawBarChart();
    // Draw the chart as a stroke.
    $pchart_image->Stroke();
?>
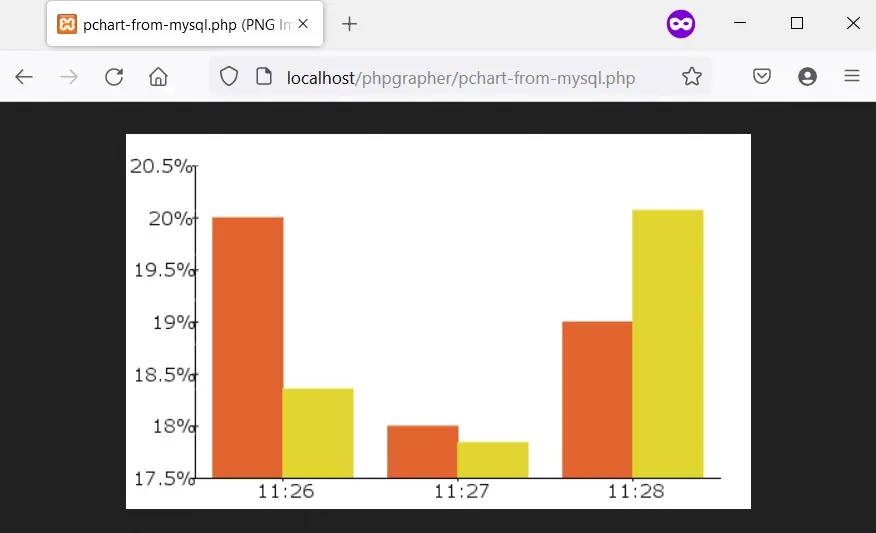
출력(시간은 다를 수 있음):

Habdul Hazeez is a technical writer with amazing research skills. He can connect the dots, and make sense of data that are scattered across different media.
LinkedIn