Dibujar un gráfico en PHP
- Configure su entorno
-
Trazar un gráfico de barras usando
pCharten PHP -
Trazar un gráfico de spline usando
pCharten PHP - Trazar un histograma en PHP desde la base de datos MySQL
Este artículo explica cómo puede crear un gráfico usando pChart en PHP. El primero es un gráfico de barras, el segundo es un gráfico de spline y el último es un histograma de MySQL.
Configure su entorno
Lo primero que necesitarás antes de usar pChart es una instalación de PHP5. Puede obtener PHP5 como parte de XAMPP 5.5.28 de SourceForge.
Cuando tenga XAMPP 5.5.28, descargue pChart de su sitio web oficial. Luego, extraiga pChart en la carpeta htdocs de XAMPP 5.5.28.
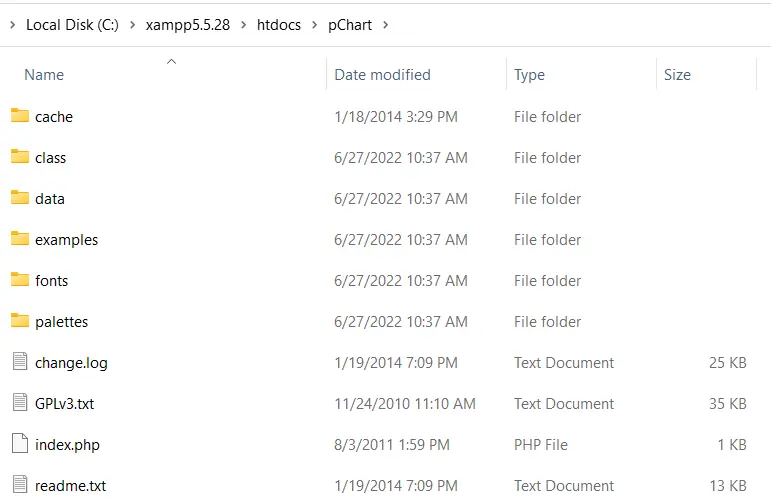
Abra la carpeta pChart, y su estructura debe ser como la siguiente imagen:
Nota:
- La carpeta
classcontiene la definición de clase que usaremos. - La carpeta
fontscontiene los archivos de fuentes que podemos usar en nuestro gráfico.
Después de completar la configuración de pChart, ahora puede comenzar a trazar.
Trazar un gráfico de barras usando pChart en PHP
El código PHP para trazar el gráfico de barras usando pChart debe incluir tres archivos de la carpeta clase. Estos archivos son:
pData.class.phppImage.class.phppDraw.class.php
De estos archivos, pData.class.php te permite cargar los datos que usarás en el gráfico. Necesitarás pDraw.class.php para dibujar el gráfico.
A continuación, pImage.class.php le permitirá representar el gráfico en su navegador web. Tendrás que incluir estos archivos usando PHP required_once().
Puedes incluirlos usando rutas relativas o definir una constante PCHART_PATH. Luego, con set_include_path(), puede usar un nombre de directorio corto para las clases pChart.
Dicho esto, podemos crear un gráfico de barras con pChart siguiendo los siguientes pasos:
-
Defina la constante
PCHART_PATH. -
Use
set_include_path()para el nombre de directorio corto de las clasespChart. -
Incluye las clases
pChartusandorequired_once(). -
Cree un nuevo objeto
pData. -
Crea tus datos o impórtalos.
-
Agregue los datos al objeto
pDatausando su métodoaddPoints. -
Crea una imagen para el gráfico usando un objeto de
pImage. -
Establezca la fuente del gráfico.
-
Configure el área del gráfico utilizando el método
setGraphAreadepData. -
Dibuje una escala y el gráfico de barras utilizando los métodos
drawScaleydrawBarChartdepData. -
Envíe información de encabezado para decirle al navegador que está enviando una imagen.
-
Renderice la imagen utilizando el método
RenderdepData. Asegúrese de pasarnullal métodoRender.
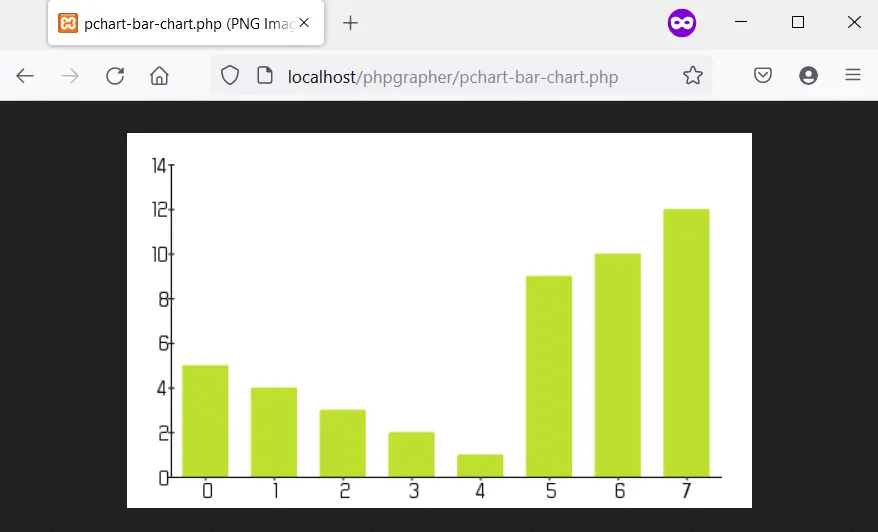
A continuación se muestra la implementación de estos pasos. Lo que sigue es la imagen de salida en Firefox 101.0.
<?php
    // The definition of the PCHART_PATH assumes
    // you have pChart one directory above your
    // current working folder.
    define("PCHART_PATH", "../pChart");
    set_include_path(get_include_path() . PATH_SEPARATOR . PCHART_PATH);
    // Since we have defined the path, and used
    // the get_include_path() function, we can
    // reference the class folder without writing
    // its full path.
    require_once "class/pDraw.class.php";
    require_once "class/pImage.class.php";
    require_once "class/pData.class.php";
    // Create the pChart Object
    $pchart_data = new pData();
    // Some sample data that we'll use to plot
    // the bar chart.
    $sample_data_set = [5, 4, 3, 2, 1, 9, 10, 12];
    $pchart_data->addPoints($sample_data_set);
    // Create the pChart Image. The first two argument
    // to the pImage object are the width and height
    // of the rendered chart.
    $pchart_image = new pImage(500, 300, $pchart_data);
    // Set the font.
    $pchart_image->setFontProperties(
    ["FontName" => PCHART_PATH . "/fonts/Forgotte.ttf",
    "FontSize" => 16]
    );
    // Define the graph area. The first two arguments
    // are the x-coordinates. While the last two are
    // the y-coordinates.
    $pchart_image->setGraphArea(35, 25, 475, 275);
    $pchart_image->drawScale();
    $pchart_image->drawBarChart();
    // Render the chart as a PNG image
    header("Content-Type: image/png");
    $pchart_image->Render(null);
?>
Producción:
Trazar un gráfico de spline usando pChart en PHP
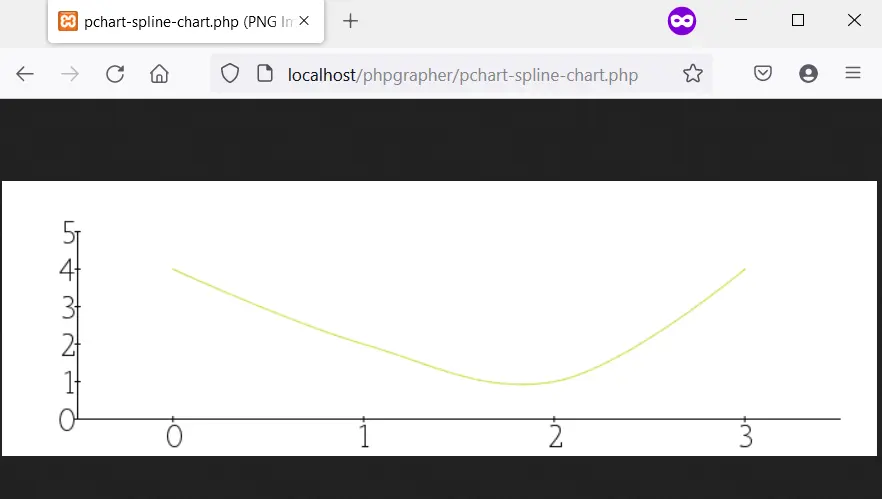
Trazar un gráfico de spline sigue el mismo proceso que hicimos para el gráfico de barras, excepto que dibuja un gráfico de spline utilizando el método drawSplineChart. Además, puede optar por no enviar el gráfico como una imagen.
En su lugar, puede optar por el método Stroke de pData para representar el gráfico en su navegador web.
El siguiente código dibuja un gráfico spline utilizando pChart. Además, estamos usando la fuente MankSans.ttf del directorio fonts.
<?php
    // The definition of the PCHART_PATH assumes
    // you have pChart one directory above your
    // current working folder.
    define("PCHART_PATH", "../pChart");
    set_include_path(get_include_path() . PATH_SEPARATOR . PCHART_PATH);
    // Since we have defined the path, and used
    // the get_include_path() function, we can
    // reference the class folder without writing
    // its full path.
    require_once "class/pDraw.class.php";
    require_once "class/pImage.class.php";
    require_once "class/pData.class.php";
    // Create the pChart Object
    $pchart_data = new pData();
    // Some sample data that we'll use to plot
    // the spline chart.
    $pchart_data->addPoints([4,2,1,4]);
    // Create the pChart Image. The first two argument
    // to the pImage object are the width and height
    // of the rendered chart.
    $pchart_image = new pImage(700, 220, $pchart_data);
    // Set the font.
    $pchart_image->setFontProperties(
        ["FontName" => PCHART_PATH . "/fonts/MankSans.ttf",
        "FontSize"=> 18]
    );
    // Define the graph area. The first two arguments
    // are the x-coordinates. While the last two are
    // the y-coordinates.
    $pchart_image->setGraphArea(60, 40, 670, 190);
    $pchart_image->drawScale();
    $pchart_image->drawSplineChart();
    // Draw the chart as a stroke.
    $pchart_image->Stroke();
?>
Producción:
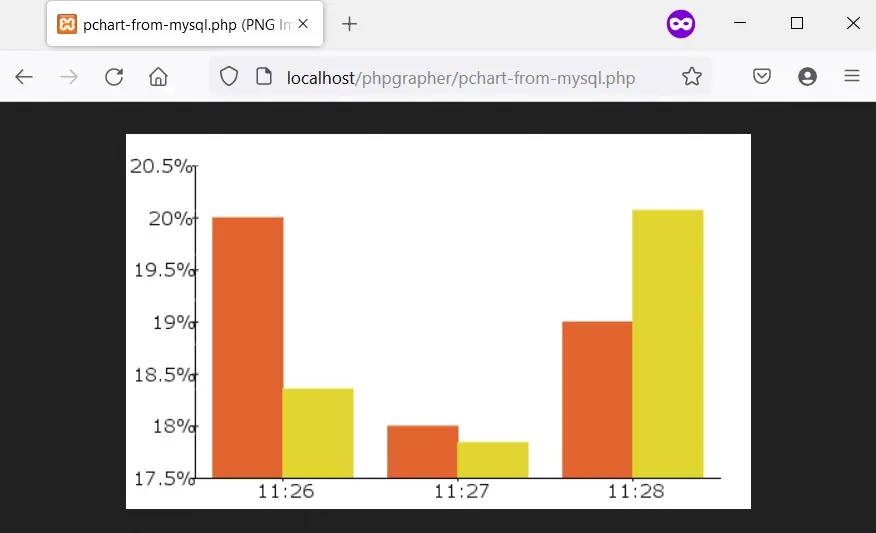
Trazar un histograma en PHP desde la base de datos MySQL
Trazar un histograma sigue pasos similares a los de un gráfico de barras y un gráfico de spline. Pero, hay algunas diferencias que vale la pena señalar.
Primero, los datos para el histograma vendrán de MySQL. Esto significa que debe tener una base de datos con algunos datos de muestra.
En segundo lugar, utilizará los nombres de las columnas de la tabla como eje del histograma. Para esto, utilizará algunos métodos pData como setAbscissa, setSeriesOnAxis y setAxisName.
Ahora, cree una base de datos llamada weather_measurements, luego cree una tabla usando lo siguiente:
CREATE TABLE measures (
    timestamp INT NOT NULL DEFAULT '0',
    temperature INT NOT NULL,
    humidity INT NOT NULL
)
Inserte datos de muestra en la tabla de medidas usando lo siguiente:
INSERT INTO measures (timestamp, temperature, humidity) VALUES (UNIX_TIMESTAMP(), 20, 50);
INSERT INTO measures (timestamp, temperature, humidity) VALUES (UNIX_TIMESTAMP(), 18, 44);
INSERT INTO measures (timestamp, temperature, humidity) VALUES (UNIX_TIMESTAMP(), 19, 70);
Asegúrese de que los datos de muestra estén en la base de datos, luego cree el histograma usando lo siguiente:
<?php
    // The definition of the PCHART_PATH assumes
    // you have pChart one directory above your
    // current working folder.
    define("PCHART_PATH", "../pChart");
    set_include_path(get_include_path() . PATH_SEPARATOR . PCHART_PATH);
    // Since we have defined the path, and used
    // the get_include_path() function, we can
    // reference the class folder without writing
    // its full path.
    require_once "class/pDraw.class.php";
    require_once "class/pImage.class.php";
    require_once "class/pData.class.php";
    // Create the pChart Object
    $pchart_data = new pData();

    // Connect to MySQL
    $connect_to_mysql = new mysqli("localhost", "root", "", "weather_measurements");

    // query the database and get the result
    $query_the_table = "SELECT * FROM measures";
    $mysql_result  = mysqli_query($connect_to_mysql, $query_the_table);
    // Declare the variables for the database
    // records as empty strings. Later, we'll
    // turn them into arrays for better performance
    $timestamp = ""; $temperature = ""; $humidity = "";
    while($row = mysqli_fetch_array($mysql_result, MYSQLI_ASSOC)) {
        $timestamp[]   = $row["timestamp"];
        $temperature[] = $row["temperature"];
        $humidity[]    = $row["humidity"];
    }

    $pchart_data->addPoints($timestamp,"Timestamp");
    $pchart_data->addPoints($temperature,"Temperature");
    $pchart_data->addPoints($humidity,"Humidity");
    // Put the table column on the appropriate axis
    $pchart_data->setAbscissa("Timestamp");
    $pchart_data->setSerieOnAxis("Humidity", 1);
    $pchart_data->setXAxisName("Time");
    $pchart_data->setXAxisDisplay(AXIS_FORMAT_TIME,"H:i");
    // Dedicate the first and second axis to
    // Temperature and Humidity.
    $pchart_data->setAxisName(0, "Temperature");
    $pchart_data->setAxisUnit(0, "°C");
    $pchart_data->setAxisName(1, "Humidity");
    $pchart_data->setAxisUnit(0, "%");
    // Create the pChart Image. The first two argument
    // to the pImage object are the width and height
    // of the rendered chart.
    $pchart_image = new pImage(500, 300, $pchart_data);
    // Set the font.
    $pchart_image->setFontProperties(
        ["FontName" => PCHART_PATH . "/fonts/verdana.ttf",
        "FontSize"=> 11]
    );
    // Set the graph area.
    $pchart_image->setGraphArea(55,25, 475,275);
    $pchart_image->drawScale();
    $pchart_image->drawBarChart();
    // Draw the chart as a stroke.
    $pchart_image->Stroke();
?>
Salida (su tiempo variará):

Habdul Hazeez is a technical writer with amazing research skills. He can connect the dots, and make sense of data that are scattered across different media.
LinkedIn