How to Set Width Parameter of Bar Graph in Matplotlib

In this demonstration, we will discuss bar graphs and look at the width parameter of the bar function in Matplotlib.
Set the Width Parameter of the Bar Graph in Matplotlib
The bar graph is a graphical display of data using bars of different heights. We can compare different types of data using this bar graph.
To create the bar graph, we can use the bar() function in Matplotlib. Let’s have a look at the syntax of this function.
Syntax:
bar(x, height, width=0.8, bottom=None, align="center", data=None, **kwargs)
The bar() has several parameters. The first two parameters, x and height, are compulsory.
It would help if you used these parameters to create the bar graph, and the rest parameters contain the default value. In this tutorial, we will explain about width parameter.
We define x and height, and the X is the x coordinate value. We can take x as the sequence of scalars.
The second parameter we have is the height. We can also take it as a sequence of scalars.
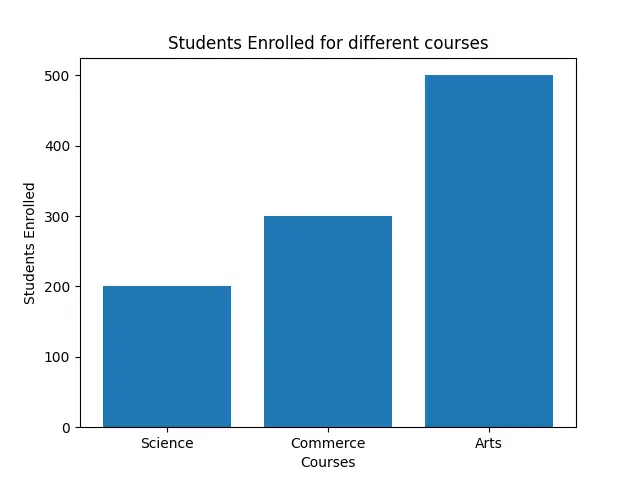
Let’s take an example to draw a bar graph to represent how many students are enrolled in courses. We will create a random list for the X coordinate and create a list of heights.
x1 = ["Science", "Commerce", "Arts"]
h = [200, 300, 500]
Now, we see the plot with the default width value.
Code:
import matplotlib.pyplot as plot

x1 = ["Science", "Commerce", "Arts"]
h = [200, 300, 500]

plot.bar(x1, h)
plot.xlabel("Courses")
plot.ylabel("Students Enrolled")
plot.title("Students Enrolled for different courses")
plot.show()
Now we can see the width of the bar is 0.8, which is the default value.
Output:
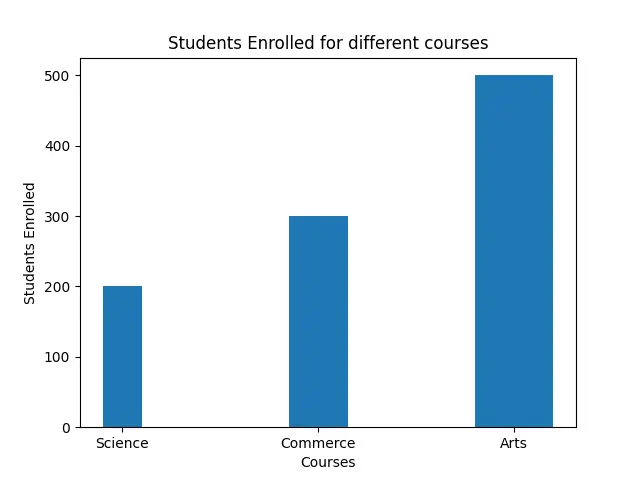
If we want to change the width, we can pass the float number. The width is the width of the bar, and it also takes the scalar value.
Code:
import matplotlib.pyplot as plot

x1 = ["Science", "Commerce", "Arts"]
h = [200, 300, 500]

plot.bar(x1, h, 0.4)
plot.xlabel("Courses")
plot.ylabel("Students Enrolled")
plot.title("Students Enrolled for different courses")
plot.show()
In the following figure, we see the width has changed.
Output:

We have another way to specify the width using the width argument.
plot.bar(x1, h, width=0.4)
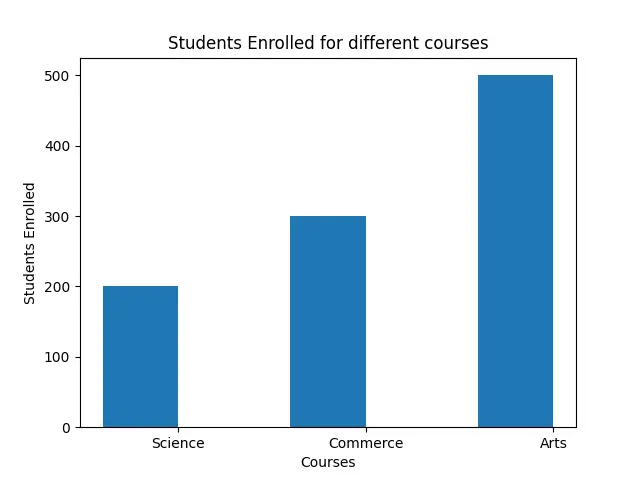
We can also pass a list of different widths with corresponding bars.
Code:
import matplotlib.pyplot as plot

x1 = ["Science", "Commerce", "Arts"]
h = [200, 300, 500]
w = [0.2, 0.3, 0.4]

plot.bar(x1, h, width=w)
plot.xlabel("Courses")
plot.ylabel("Students Enrolled")
plot.title("Students Enrolled for different courses")
plot.show()
Here see different widths for different courses.
Output:
The default alignment of the bar is the center. We will see the left alignment if we pass "edge" to the align argument.
If we want to make this alignment on the right side, we need to take width as the negative value.
Code:
import matplotlib.pyplot as plot

x1 = ["Science", "Commerce", "Arts"]
h = [200, 300, 500]

plot.bar(x1, h, width=-0.4, align="edge")
plot.xlabel("Courses")
plot.ylabel("Students Enrolled")
plot.title("Students Enrolled for different courses")
plot.show()
Output:

Hello! I am Salman Bin Mehmood(Baum), a software developer and I help organizations, address complex problems. My expertise lies within back-end, data science and machine learning. I am a lifelong learner, currently working on metaverse, and enrolled in a course building an AI application with python. I love solving problems and developing bug-free software for people. I write content related to python and hot Technologies.
LinkedIn