Pandas Plot Multiple Columns on Bar Chart With Matplotlib
- Setting Up Your Environment
- Creating a Sample DataFrame
- Plotting Multiple Columns on a Bar Chart
- Customizing the Bar Chart
- Saving the Bar Chart
- Conclusion
- FAQ

In this tutorial, we will explore how we can plot multiple columns on a bar chart using the plot() method of the DataFrame object. Visualizing data is a crucial part of data analysis, and bar charts provide a clear way to compare different categories. With Pandas and Matplotlib, you can easily create insightful visualizations that help in understanding your data better.
Whether you are working on a small project or a large dataset, this guide will walk you through the steps to effectively plot multiple columns on a bar chart. By the end of this article, you will have a solid understanding of how to leverage these powerful libraries to create stunning visual representations of your data.
Setting Up Your Environment
Before diving into the plotting, ensure you have the necessary libraries installed. You need both Pandas and Matplotlib for this tutorial. If you haven’t installed them yet, you can do so using pip:
pip install pandas matplotlib
Once you have the libraries installed, you’re ready to start plotting. Let’s create a sample DataFrame that we will use throughout this tutorial. We’ll generate some sample data to illustrate how to plot multiple columns on a bar chart.
Creating a Sample DataFrame
Let’s create a simple DataFrame that contains sales data for different products over several months.
import pandas as pd

data = {
    'Month': ['January', 'February', 'March', 'April'],
    'Product_A': [200, 220, 250, 300],
    'Product_B': [150, 180, 210, 250],
    'Product_C': [100, 130, 170, 200]
}

df = pd.DataFrame(data)
print(df)
Output:
       Month  Product_A  Product_B  Product_C
0    January        200        150        100
1   February        220        180        130
2      March        250        210        170
3      April        300        250        200
In this DataFrame, we have monthly sales data for three products. The Month column contains the months, while the other columns represent the sales figures for each product. This structure makes it easy to visualize the sales trends over time.
Plotting Multiple Columns on a Bar Chart
Now that we have our DataFrame ready, let’s plot multiple columns on a bar chart. The plot() method in Pandas allows us to create a bar chart by specifying the kind of plot we want. Here’s how to do it:
import matplotlib.pyplot as plt

df.set_index('Month').plot(kind='bar')
plt.title('Monthly Sales Data')
plt.xlabel('Month')
plt.ylabel('Sales')
plt.xticks(rotation=45)
plt.legend(title='Products')
plt.tight_layout()
plt.show()
Output:
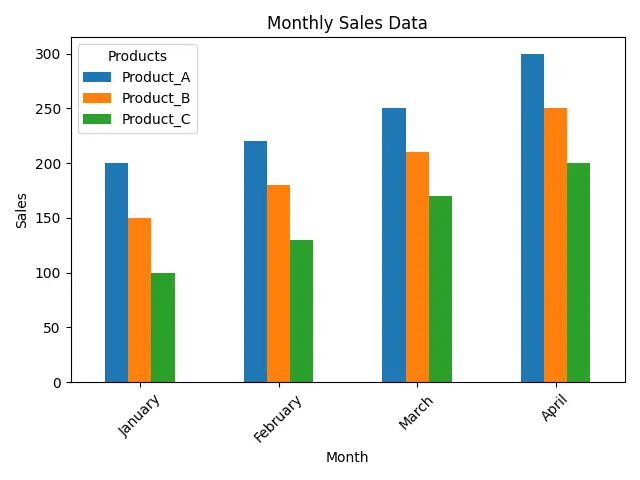
In this code, we first set the Month column as the index of the DataFrame using set_index(). This is important because it allows the bar chart to use the month names as labels on the x-axis. The plot() method is called with kind='bar', which tells Pandas we want a bar chart. We then customize the chart by adding titles and labels for better readability.
The use of plt.legend(title='Products') ensures that our chart has a legend indicating which color corresponds to which product. Finally, plt.tight_layout() adjusts the subplot parameters for a cleaner look, and plt.show() displays the chart.
Customizing the Bar Chart
While the basic bar chart is informative, you can customize it further to enhance its visual appeal. Let’s explore how to change colors, add gridlines, and adjust the figure size.
colors = ['#1f77b4', '#ff7f0e', '#2ca02c']

ax = df.set_index('Month').plot(kind='bar', color=colors, figsize=(10, 6))
plt.title('Monthly Sales Data')
plt.xlabel('Month')
plt.ylabel('Sales')
plt.xticks(rotation=45)
plt.grid(axis='y', linestyle='--', alpha=0.7)
plt.legend(title='Products')
plt.tight_layout()
plt.show()
In this modified version, we define a list of colors to assign to each product. The figsize parameter in plot() allows us to specify the size of the figure, making it more suitable for presentations or reports. Adding gridlines with plt.grid(axis='y', linestyle='--', alpha=0.7) enhances readability, especially when comparing the sales figures.
Saving the Bar Chart
After creating a visually appealing bar chart, you might want to save it for future use. Matplotlib provides an easy way to save figures using the savefig() function. Here’s how you can modify the previous code to save the chart as an image file.
ax = df.set_index('Month').plot(kind='bar', color=colors, figsize=(10, 6))
plt.title('Monthly Sales Data')
plt.xlabel('Month')
plt.ylabel('Sales')
plt.xticks(rotation=45)
plt.grid(axis='y', linestyle='--', alpha=0.7)
plt.legend(title='Products')
plt.tight_layout()

plt.savefig('monthly_sales_data.png', dpi=300)
plt.show()
Output:
The bar chart is saved as 'monthly_sales_data.png' in the current directory.
In this example, we added plt.savefig('monthly_sales_data.png', dpi=300) before plt.show(). This command saves the figure as a PNG file with a resolution of 300 dots per inch (dpi), ensuring high quality for printing or sharing. Make sure to specify the desired file format in the filename.
Conclusion
In this tutorial, we have covered how to plot multiple columns on a bar chart using Pandas and Matplotlib. From creating a sample DataFrame to customizing and saving your chart, you now have the tools to visualize your data effectively. Bar charts are a great way to compare different categories, and by using these libraries, you can create professional-looking visualizations with minimal effort. Whether you are analyzing sales data, survey results, or any other dataset, the techniques discussed here will help you present your findings clearly and compellingly.
FAQ
-
How do I install Pandas and Matplotlib?
You can install both libraries using pip with the command: pip install pandas matplotlib. -
Can I customize the colors of the bars in the chart?
Yes, you can customize the colors by passing a list of color codes to thecolorparameter in theplot()method. -
What file formats can I save the bar chart in?
You can save the chart in various formats such as PNG, JPEG, PDF, and SVG by changing the file extension in thesavefig()method. -
How can I add data labels to the bars in the chart?
You can use a loop to annotate each bar with its value using theax.text()method after plotting the bars. -
Is it possible to plot horizontal bar charts?
Yes, you can create horizontal bar charts by setting thekindparameter to ‘barh’ in theplot()method.

Suraj Joshi is a backend software engineer at Matrice.ai.
LinkedIn