How to Set Number of Ticks in Matplotlib
-
Set Number of Ticks Using the
Matplotlib.ticker.MaxNLocatorClass -
Set Number Ticks Using the
Matplotlib.axis.Axis.set_ticks()Method

This tutorial explains how we can set the number of ticks in a Matplotlib figure using the Matplotlib.ticker.MaxNLocator class and set_ticks() method.
import math
import numpy as np
import matplotlib.pyplot as plt

x = np.linspace(0, 2 * math.pi, 100)
y = np.sin(x)

fig, axes = plt.subplots(1, 1)

axes.plot(x, y)
axes.set_title("Sinx Function")
axes.set_xlabel("X")
axes.set_ylabel("sinX")
plt.show()
Output:
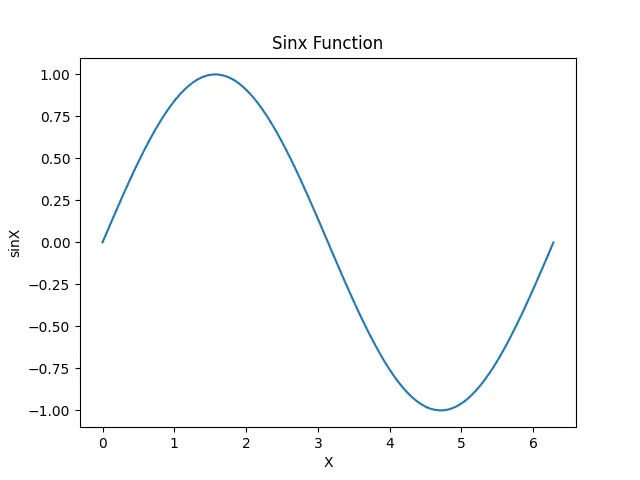
It shows a Matplotlib figure with the default number of ticks. We will change the number of ticks in the figure using different methods.
Set Number of Ticks Using the Matplotlib.ticker.MaxNLocator Class
The Matplotlib.ticker.MaxNLocator class defines a parameter named nbins which represents the maximum number of bins. The number of ticks will be one more than the number of bins. So the nbins parameter in the Matplotlib.ticker.MaxNLocator class implies that the number of ticks cannot be more than nbins+1.
import math
import numpy as np
import matplotlib.pyplot as plt
from matplotlib.ticker import MaxNLocator

x = np.linspace(0, 2 * math.pi, 100)
y = np.sin(x)

fig, axes = plt.subplots(1, 1)

axes.plot(x, y)
axes.yaxis.set_major_locator(MaxNLocator(5))
axes.set_title("Sinx Function")
axes.set_xlabel("X")
axes.set_ylabel("sinX")
plt.show()
Output:
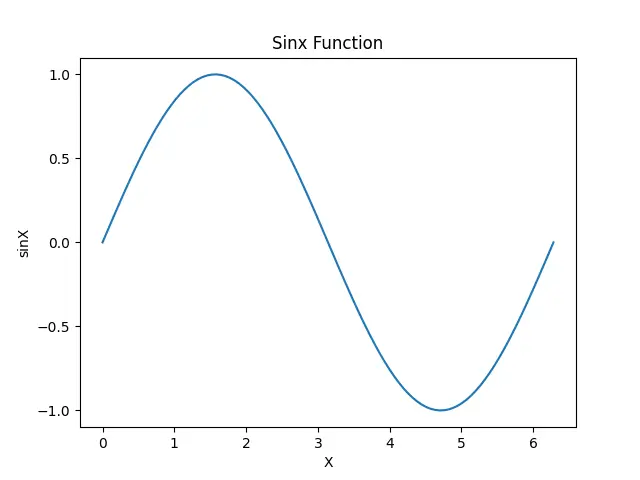
It sets the maximum number of bins for the Y-axis in the figure to 5, which implies the maximum number of ticks is 6. Similarly, we can set ticks for the X-axis, too.
Alternatively, we can also use certain conditions with the if statement to only select the particular ticks satisfying the condition.
import math
import numpy as np
import matplotlib.pyplot as plt

x = np.linspace(0, 2 * math.pi, 100)
y = np.sin(x)

fig, axes = plt.subplots(1, 1)

axes.plot(x, y)
for i, tick in enumerate(axes.xaxis.get_ticklabels()):
    if i % 2 != 0:
        tick.set_visible(False)
for i, tick in enumerate(axes.yaxis.get_ticklabels()):
    if i % 2 != 0:
        tick.set_visible(False)
axes.set_title("Sinx Function")
axes.set_xlabel("X")
axes.set_ylabel("sinX")
plt.show()
Output:
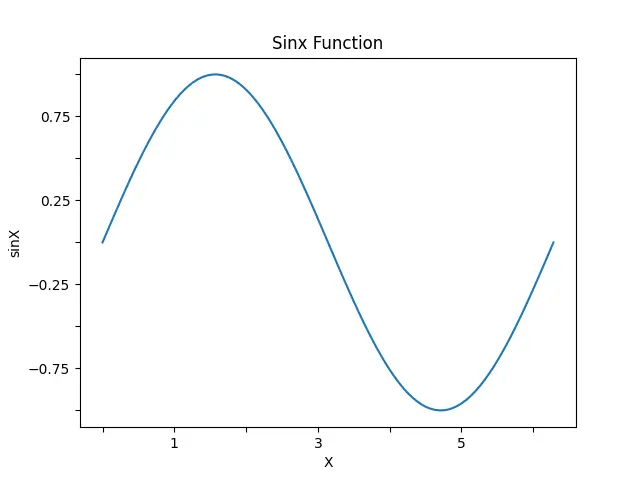
It sets tick labels for only ticks at even position in both the X and Y-axis. Although it removes tick labels, the ticks are still there. We can change the condition to customize tick labels.
Set Number Ticks Using the Matplotlib.axis.Axis.set_ticks() Method
We can also set the axes using the Matplotlib.axis.Axis.set_ticks() in Python.
import math
import numpy as np
import matplotlib.pyplot as plt

x = np.linspace(0, 2 * math.pi, 100)
y = np.sin(x)

fig, axes = plt.subplots(1, 1)

axes.plot(x, y)
axes.xaxis.set_ticks([0, 1, 3, 4, 5, 6])
axes.yaxis.set_ticks(np.linspace(-1, 1, 5))
axes.set_title("Sinx Function")
axes.set_xlabel("X")
axes.set_ylabel("sinX")
plt.show()
Output:
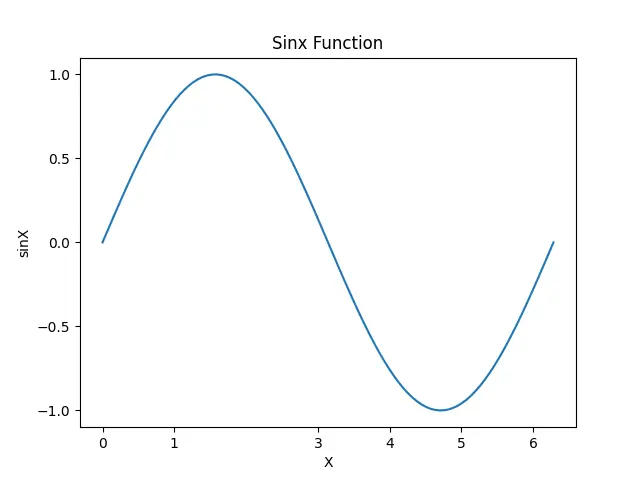
It sets the number of ticks and tick values specified in the set_ticks() method. We pass a NumPy array or a list to the set_ticks() based upon which the tick values will be set.

Suraj Joshi is a backend software engineer at Matrice.ai.
LinkedIn