How to Plot Time Series in Matplotlib
-
Plot Time Series Data in Matplotlib by Converting Text to the
datetime.datetimeFormat -
Plot Time Series Data in Matplotlib Using the
matplotlib.pyplot.plot_date()Method
To plot a time series data in Python, we can convert the dates in text format to datetime.datetime format using the datetime.strptime() function. We can also use the matplotlib.pyplot.plot_date() function.
Plot Time Series Data in Matplotlib by Converting Text to the datetime.datetime Format
from datetime import datetime
import matplotlib.pyplot as plt

dates = [
    "2020-may-20",
    "2020-may-21",
    "2020-may-22",
    "2020-may-23",
    "2020-may-24",
    "2020-may-25",
    "2020-may-26",
]
x = [datetime.strptime(date, "%Y-%b-%d").date() for date in dates]
y = [20, 30, 35, 18, 24, 28, 26]

plt.plot(x, y, marker="o")
plt.gcf().set_size_inches(9, 7)
plt.show()
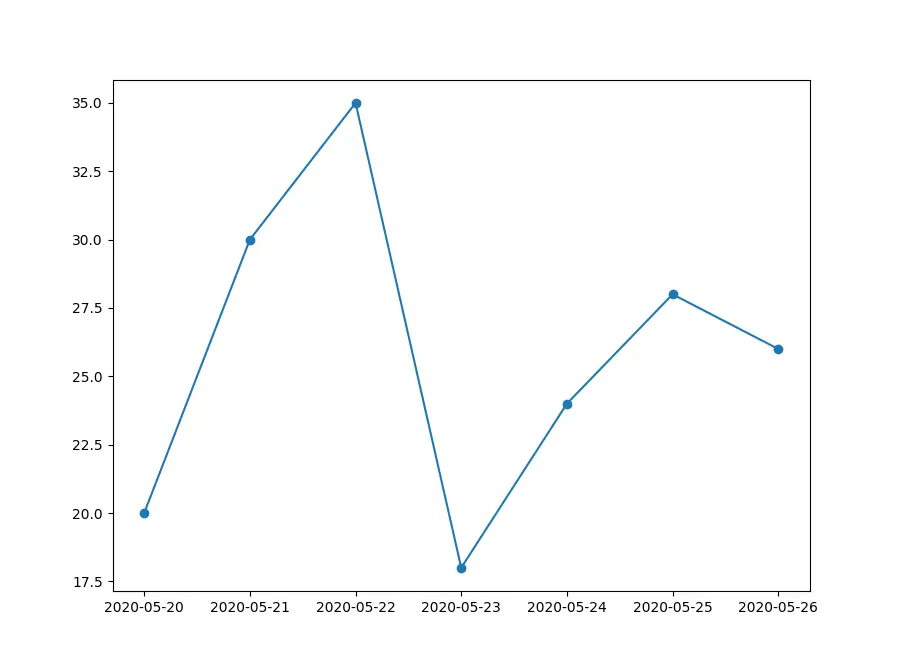
Output:
It generates the plot of given time-series data in the dates list by first converting the date in the text to datetime format using the strptime() method. Using the date() method to the datetime object, we ignore the time part of the datetime object. We then plot the data in the datetime format using the plot() method.
Plot Time Series Data in Matplotlib Using the matplotlib.pyplot.plot_date() Method
If the dates are in the datetime format, we can use the matplotlib.pyplot.plot_date() method to generate a time series plot from the data.
from datetime import datetime
import matplotlib.pyplot as plt

dates = [
    "2020-may-20",
    "2020-may-21",
    "2020-may-22",
    "2020-may-23",
    "2020-may-24",
    "2020-may-25",
    "2020-may-26",
]
x = [datetime.strptime(date, "%Y-%b-%d").date() for date in dates]
y = [20, 30, 35, 18, 24, 28, 26]

plt.plot_date(x, y)
plt.gcf().set_size_inches(8, 6)
plt.tight_layout()
plt.show()
Output:
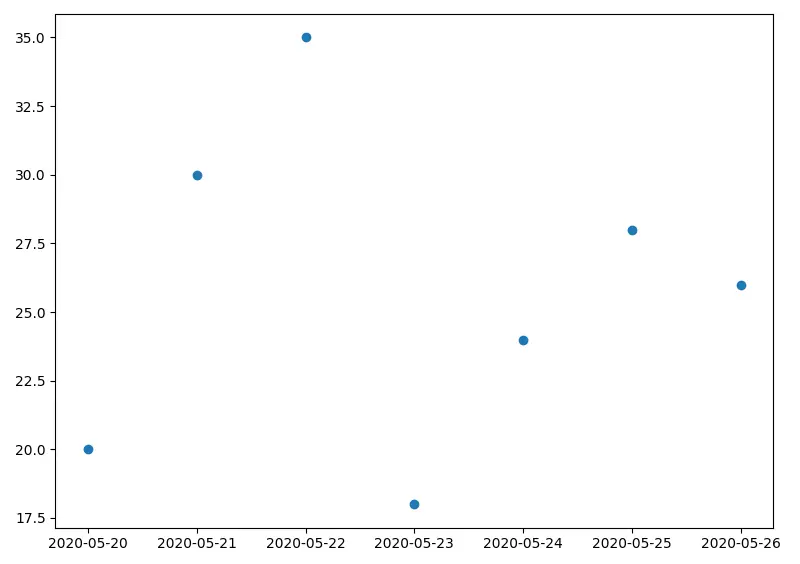
It will create a scatter plot of the time series data. If we want to create a line plot, we use linestyle ='solid' as an argument in the plot_date() method.
from datetime import datetime
import matplotlib.pyplot as plt

dates = [
    "2020-may-20",
    "2020-may-21",
    "2020-may-22",
    "2020-may-23",
    "2020-may-24",
    "2020-may-25",
    "2020-may-26",
]
x = [datetime.strptime(date, "%Y-%b-%d").date() for date in dates]
y = [20, 30, 35, 18, 24, 28, 26]

plt.plot_date(x, y, linestyle="solid")
plt.gcf().set_size_inches(8, 6)
plt.tight_layout()
plt.show()
Output:
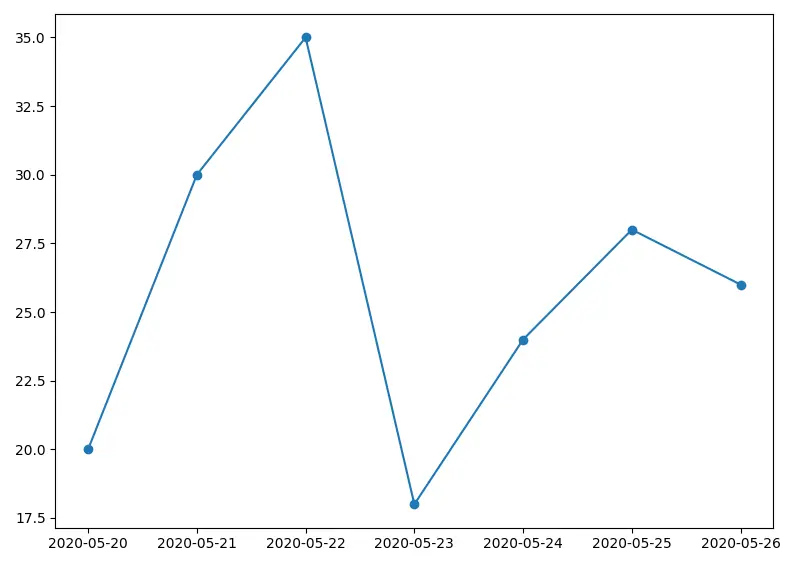
It will generate the line plot of the time series data using the matplotlib.pyplot.plot_date() method.

Suraj Joshi is a backend software engineer at Matrice.ai.
LinkedIn