Matplotlib 绘制时间序列
Suraj Joshi
2023年1月30日
Matplotlib
-
在 Matplotlib 中通过将文本转换为
datetime.datetime格式来绘制时间序列数据 -
在 Matplotlib 中使用
matplotlib.pyplot.plot_date()方法绘制时间序列数据
要在 Python 中绘制时间序列数据,我们可以使用 datetime.datetime 函数将文本格式的日期转换为 datetime.strptime() 格式。我们也可以使用 matplotlib.pyplot.plot_date() 函数。
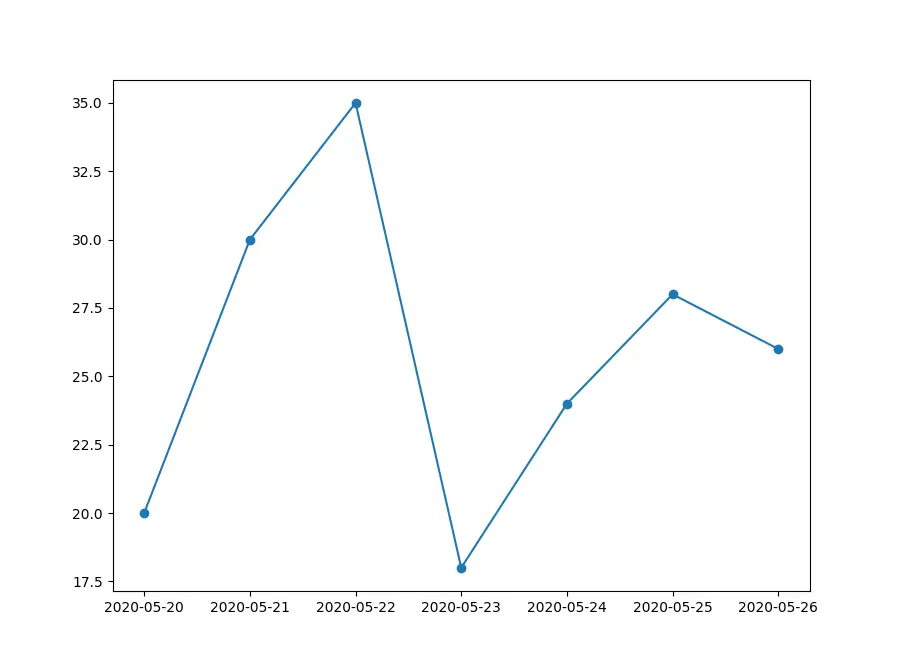
在 Matplotlib 中通过将文本转换为 datetime.datetime 格式来绘制时间序列数据
from datetime import datetime
import matplotlib.pyplot as plt

dates = [
    "2020-may-20",
    "2020-may-21",
    "2020-may-22",
    "2020-may-23",
    "2020-may-24",
    "2020-may-25",
    "2020-may-26",
]
x = [datetime.strptime(date, "%Y-%b-%d").date() for date in dates]
y = [20, 30, 35, 18, 24, 28, 26]

plt.plot(x, y, marker="o")
plt.gcf().set_size_inches(9, 7)
plt.show()
输出:
它通过首先使用 strptime() 方法将文本中的日期转换为 datetime 格式,生成 dates 列表中给定时间序列数据的图。使用 date() 方法对 datetime 对象进行处理,我们忽略 datetime 对象的时间部分。然后我们使用 plot() 方法绘制 datetime 格式的数据。
在 Matplotlib 中使用 matplotlib.pyplot.plot_date() 方法绘制时间序列数据
如果日期是 datetime 格式,我们可以使用 matplotlib.pyplot.plot_date() 方法从数据中生成一个时间序列图。
from datetime import datetime
import matplotlib.pyplot as plt

dates = [
    "2020-may-20",
    "2020-may-21",
    "2020-may-22",
    "2020-may-23",
    "2020-may-24",
    "2020-may-25",
    "2020-may-26",
]
x = [datetime.strptime(date, "%Y-%b-%d").date() for date in dates]
y = [20, 30, 35, 18, 24, 28, 26]

plt.plot_date(x, y)
plt.gcf().set_size_inches(8, 6)
plt.tight_layout()
plt.show()
输出:
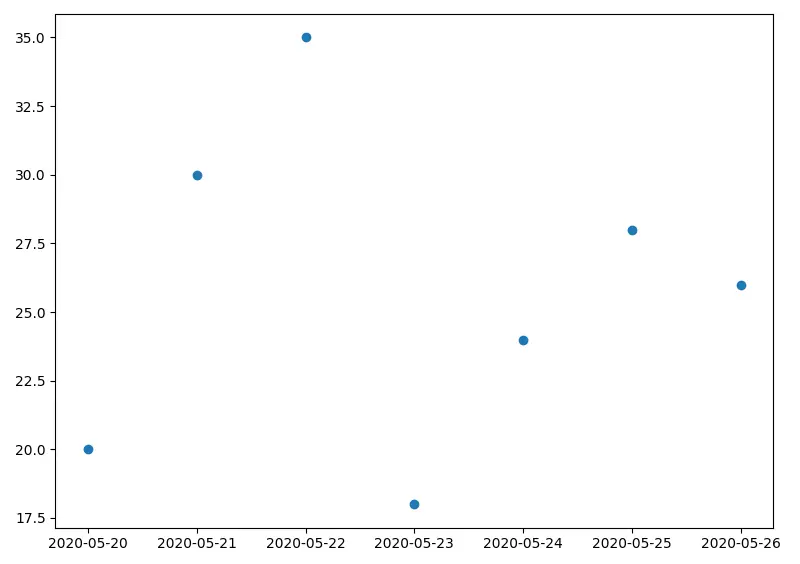
它将创建一个时间序列数据的散点图。如果我们想创建一个线图,我们使用 linestyle ='solid'作为 plot_date() 方法的参数。
from datetime import datetime
import matplotlib.pyplot as plt

dates = [
    "2020-may-20",
    "2020-may-21",
    "2020-may-22",
    "2020-may-23",
    "2020-may-24",
    "2020-may-25",
    "2020-may-26",
]
x = [datetime.strptime(date, "%Y-%b-%d").date() for date in dates]
y = [20, 30, 35, 18, 24, 28, 26]

plt.plot_date(x, y, linestyle="solid")
plt.gcf().set_size_inches(8, 6)
plt.tight_layout()
plt.show()
输出:
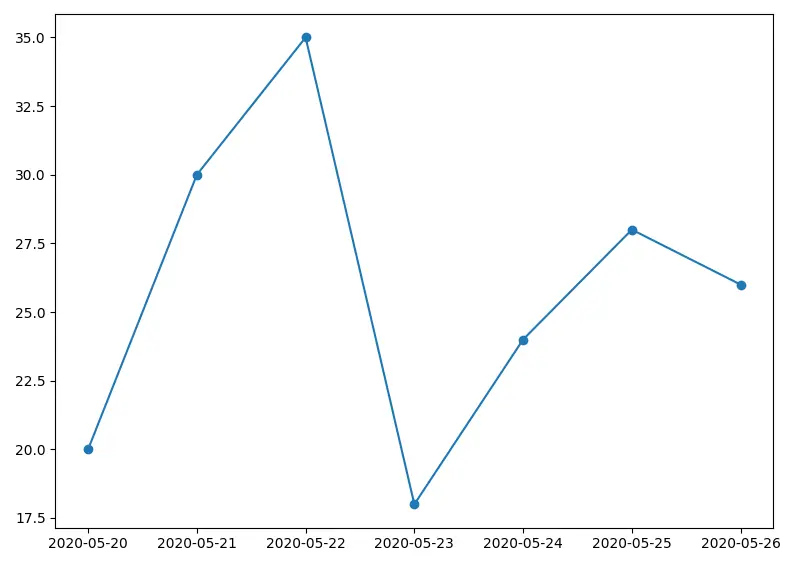
它将使用 matplotlib.pyplot.plot_date() 方法生成时间序列数据的线图。
Enjoying our tutorials? Subscribe to DelftStack on YouTube to support us in creating more high-quality video guides. Subscribe
作者: Suraj Joshi

Suraj Joshi is a backend software engineer at Matrice.ai.
LinkedIn