Matplotlib 3D Projection
This tutorial explains how we can create 3D plots in Matplotlib using the mplot3d package from the mpl_toolkits library.
Plot 3D Axes in Matplotlib
from mpl_toolkits import mplot3d
import matplotlib.pyplot as plt

axes = plt.axes(projection="3d")
axes.set_title("3d axes in Matplotlib", fontsize=14, fontweight="bold")
axes.set_xlabel("X")
axes.set_ylabel("Y")
axes.set_zlabel("Z")
plt.show()
Output:
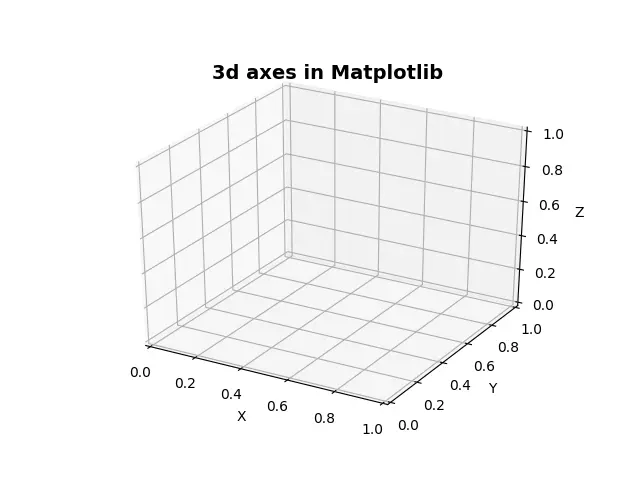
It creates a 3D plot with X, Y, and Z axes on it. To create a 3d Matplotlib plot, we import the mplot3d package from the mpl_toolkits library. The mpl_toolkits is installed while we are installing Matplotlib using pip.
Plotting 3D axes on a Matplotlib figure is similar to 2D axes plotting. We just set projection="3d" in matplotlib.pyplot.axes() to plot a 3D axes in Matplotlib.
We must make sure the version of Matplotlib is 1.0 or higher.
3D Scatter Plot in Matplotlib
import numpy as np
from mpl_toolkits import mplot3d
import matplotlib.pyplot as plt

x = np.random.randint(20, size=60)
y = np.random.randint(15, size=60)
z = np.random.randint(10, size=60)

fig = plt.figure(figsize=(8, 6))
axes = plt.axes(projection="3d")
axes.plot3D(x, y, z, color="red")
axes.set_title("3d Line plot in Matplotlib", fontsize=14, fontweight="bold")
axes.set_xlabel("X")
axes.set_ylabel("Y")
axes.set_zlabel("Z")
plt.tight_layout()
plt.show()
Output:
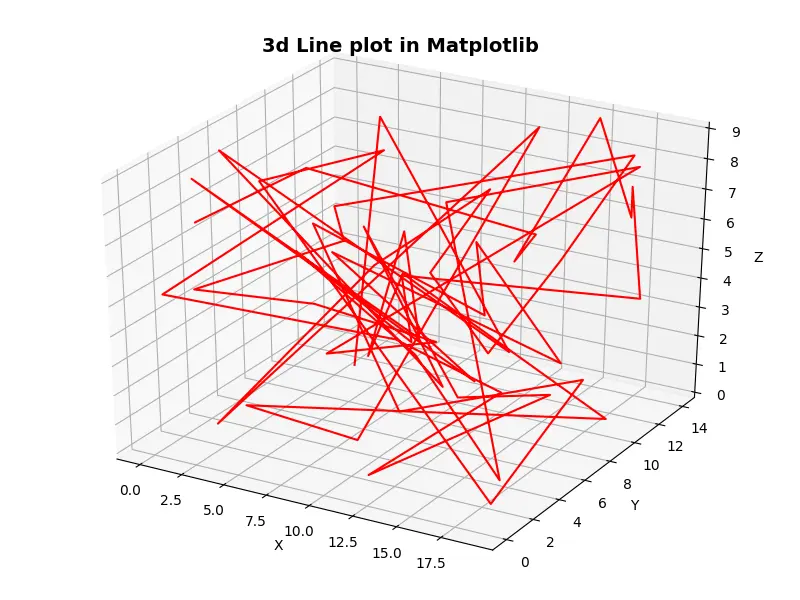
It creates a 3D line plot in Matplotlib. To create a 3D line plot in Matplotlib, we first create the axes and then use the plot3D() method to create the 3D line plot. We pass the X, Y and Z coordinates of the points to be plotted as an argument to the plot3D() method.
3D Scatter Plot in Matplotlib
import numpy as np
from mpl_toolkits import mplot3d
import matplotlib.pyplot as plt

x = np.random.randint(20, size=60)
y = np.random.randint(15, size=60)
z = np.random.randint(10, size=60)

fig = plt.figure(figsize=(8, 6))
axes = plt.axes(projection="3d")
axes.scatter3D(x, y, z, color="red")
axes.set_title("3d Sactter plot in Matplotlib", fontsize=14, fontweight="bold")
axes.set_xlabel("X")
axes.set_ylabel("Y")
axes.set_zlabel("Z")
plt.tight_layout()
plt.show()
Output:
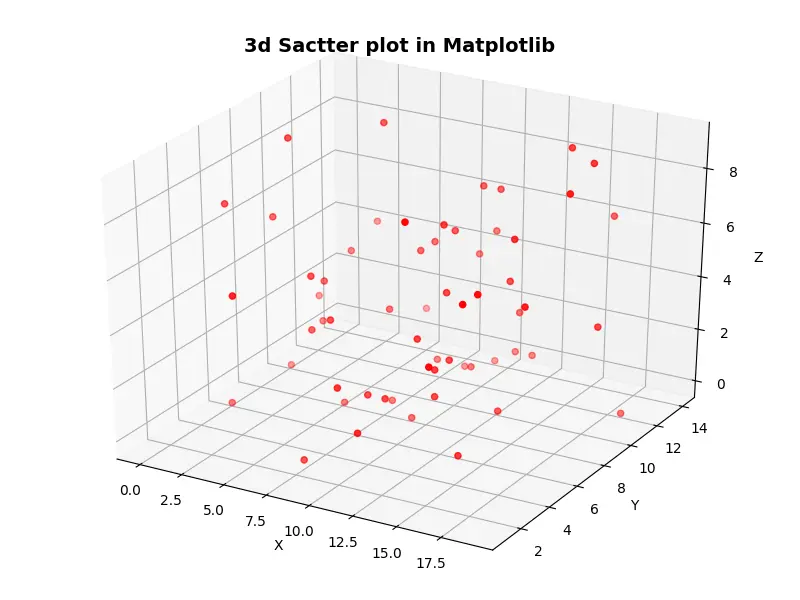
It creates a 3D scatter plot in Matplotlib. To create a 3D scatter plot in Matplotlib, we first create the axes and then use the scatter3D() method to create the 3D scatter plot. We pass the X, Y and Z coordinates of the points to be plotted as an argument to the scatter3D() method.
Note that we add 3D at the end of the name of 2D plotting functions to generate the corresponding 3D plots. e.g. plot() function makes 2D line plot while plot3D() generates the 3D line plot.

Suraj Joshi is a backend software engineer at Matrice.ai.
LinkedIn