Matplotlib 3D 프로젝션
이 튜토리얼에서는mpl_toolkits 라이브러리의mplot3d 패키지를 사용하여 Matplotlib에서 3D 플롯을 만드는 방법을 설명합니다.
Matplotlib에서 3D 축 플로팅
from mpl_toolkits import mplot3d
import matplotlib.pyplot as plt

axes = plt.axes(projection="3d")
axes.set_title("3d axes in Matplotlib", fontsize=14, fontweight="bold")
axes.set_xlabel("X")
axes.set_ylabel("Y")
axes.set_zlabel("Z")
plt.show()
출력:
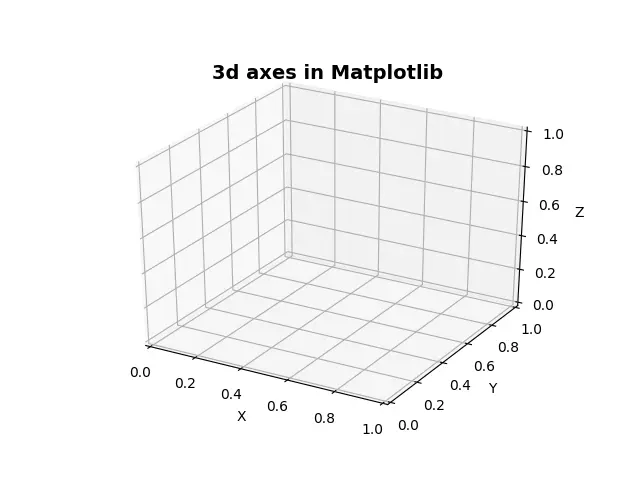
X,Y,Z 축이있는 3D 플롯을 생성합니다. 3d Matplotlib 플롯을 생성하기 위해mpl_toolkits 라이브러리에서mplot3d 패키지를 가져옵니다. pip를 사용하여 Matplotlib를 설치하는 동안mpl_toolkits가 설치됩니다.
Matplotlib 그림에 3D 축을 그리는 것은 2D 축 플로팅과 비슷합니다. matplotlib.pyplot.axes()에서projection="3d"를 설정하여 Matplotlib에서 3D 축을 플로팅합니다.
Matplotlib의 버전이1.0 이상인지 확인해야합니다.
Matplotlib의 3D 산점도
import numpy as np
from mpl_toolkits import mplot3d
import matplotlib.pyplot as plt

x = np.random.randint(20, size=60)
y = np.random.randint(15, size=60)
z = np.random.randint(10, size=60)

fig = plt.figure(figsize=(8, 6))
axes = plt.axes(projection="3d")
axes.plot3D(x, y, z, color="red")
axes.set_title("3d Line plot in Matplotlib", fontsize=14, fontweight="bold")
axes.set_xlabel("X")
axes.set_ylabel("Y")
axes.set_zlabel("Z")
plt.tight_layout()
plt.show()
출력:
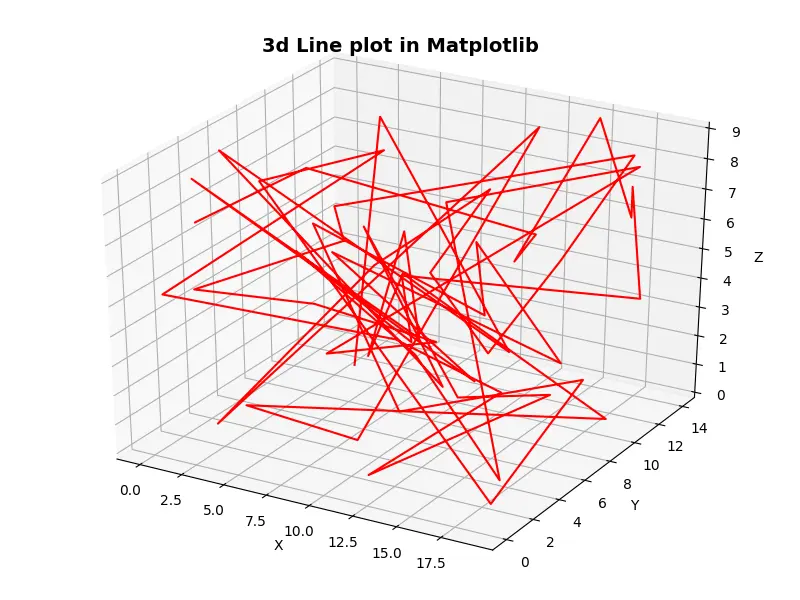
Matplotlib에서 3D 라인 플롯을 생성합니다. Matplotlib에서 3D 라인 플롯을 생성하려면 먼저 축을 생성 한 다음plot3D()메서드를 사용하여 3D 라인 플롯을 생성합니다. 플로팅 할 점의X,Y,Z 좌표를plot3D()메서드에 인수로 전달합니다.
Matplotlib의 3D 산점도
import numpy as np
from mpl_toolkits import mplot3d
import matplotlib.pyplot as plt

x = np.random.randint(20, size=60)
y = np.random.randint(15, size=60)
z = np.random.randint(10, size=60)

fig = plt.figure(figsize=(8, 6))
axes = plt.axes(projection="3d")
axes.scatter3D(x, y, z, color="red")
axes.set_title("3d Sactter plot in Matplotlib", fontsize=14, fontweight="bold")
axes.set_xlabel("X")
axes.set_ylabel("Y")
axes.set_zlabel("Z")
plt.tight_layout()
plt.show()
출력:
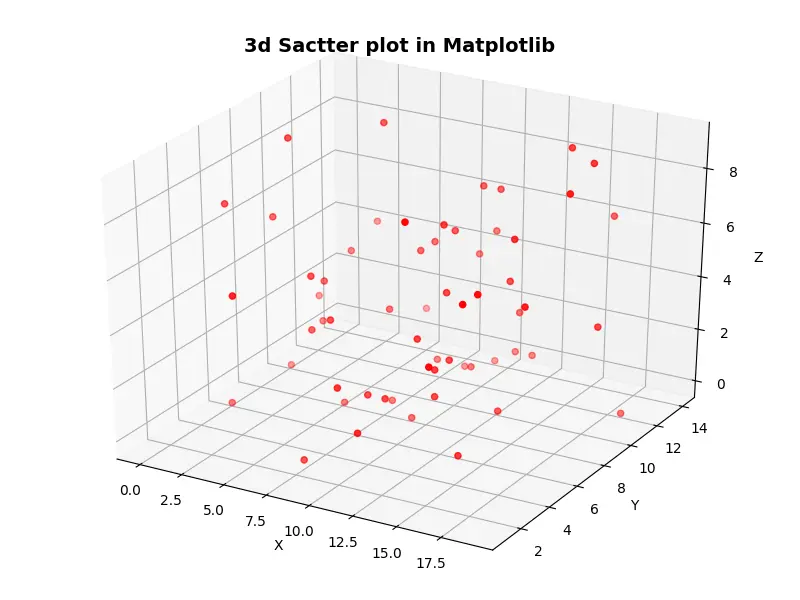
Matplotlib에서 3D 산점도를 생성합니다. Matplotlib에서 3D 산점도를 생성하려면 먼저 축을 생성 한 다음scatter3D()메서드를 사용하여 3D 산점도를 생성합니다. 플로팅 할 점의X,Y,Z 좌표를scatter3D()메서드에 인수로 전달합니다.
2D 플로팅 함수의 이름 끝에 3D를 추가하여 해당 3D 플롯을 생성합니다. 예 : plot()함수는 2D 선 플롯을 만들고plot3D()는 3D 선 플롯을 생성합니다.

Suraj Joshi is a backend software engineer at Matrice.ai.
LinkedIn