How to Display Multiple Images in One Figure Correctly in Matplotlib

The core idea for displaying multiple images in a figure is to iterate over the list of axes to plot individual images. We use the imshow() method to display individual images.
Use Matplotlib add_subplot() in for Loop
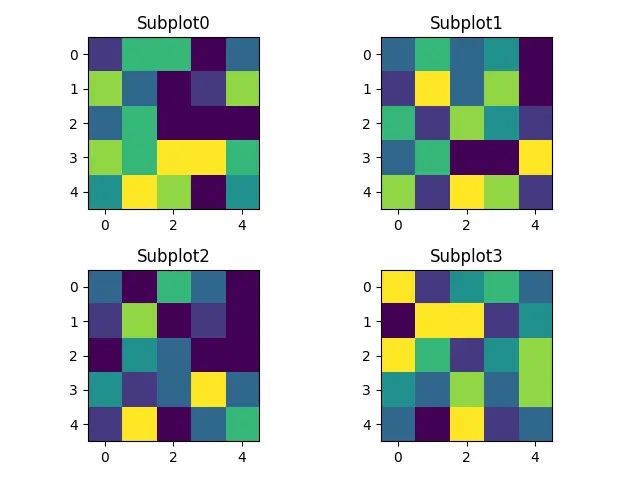
The simplest approach to display multiple images in a figure might be displaying every image using add_subplot() to initiate subplot and imshow() method to display an image inside a for loop.
Syntax for add_subplot() method:
add_subplot(rows, columns, i)
where rows and columns represent the total number of rows and columns in composite figure and i represents the index of the image to be displayed.
import numpy as np
import matplotlib.pyplot as plt

width = 5
height = 5
rows = 2
cols = 2
axes = []
fig = plt.figure()

for a in range(rows * cols):
    b = np.random.randint(7, size=(height, width))
    axes.append(fig.add_subplot(rows, cols, a + 1))
    subplot_title = "Subplot" + str(a)
    axes[-1].set_title(subplot_title)
    plt.imshow(b)
fig.tight_layout()
plt.show()
Output:
We can add more flexibility in the above code to to plot more features on selected axes and provide access to each axes of subplots.
import numpy as np
import matplotlib.pyplot as plt

width = 5
height = 5
rows = 2
cols = 2
fig = plt.figure()

x = np.linspace(-3, 3, 100)
y1 = np.sin(x)
y2 = 1 / (1 + np.exp(-x))

axes = []

for i in range(cols * rows):
    b = np.random.randint(10, size=(height, width))
    axes.append(fig.add_subplot(rows, cols, i + 1))
    subplot_title = "Subplot" + str(i)
    axes[-1].set_title(subplot_title)
    plt.imshow(b)

axes[1].plot(x, y1)
axes[3].plot(x, y2)
fig.tight_layout()

plt.show()
Output:
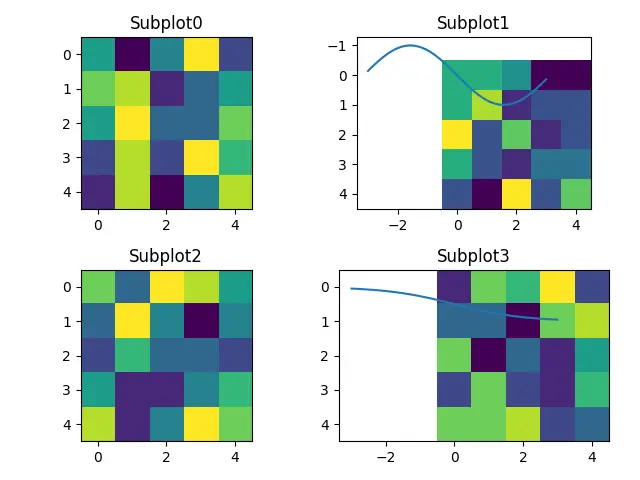
Here, axes enables access to manipulate each of subplots.
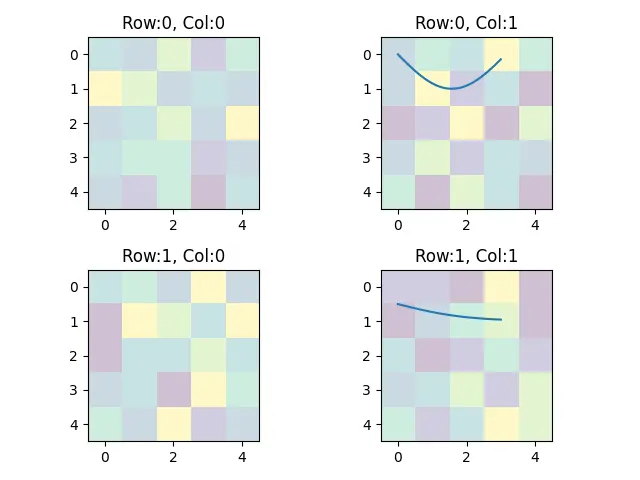
Alternatively, we can also provide access to each of the sub-plots with [row_index][column_index], which is more helpful when we have array of multiple images.
import numpy as np
import matplotlib.pyplot as plt

width = 5
height = 5
rows = 2
cols = 2

x = np.linspace(0, 3, 100)
y1 = np.sin(x)
y2 = 1 / (1 + np.exp(-x))

figure, axes = plt.subplots(nrows=rows, ncols=cols)

for a, b in enumerate(axes.flat):
    image = np.random.randint(7, size=(height, width))
    b.imshow(image, alpha=0.25)
    r = a // cols
    c = a % cols
    subtitle = "Row:" + str(r) + ", Col:" + str(c)
    b.set_title(subtitle)

axes[0][1].plot(x, y1)
axes[1][1].plot(x, y2)

figure.tight_layout()
plt.show()
Output:
Define a Function Based on the Subplots in Matplotlib
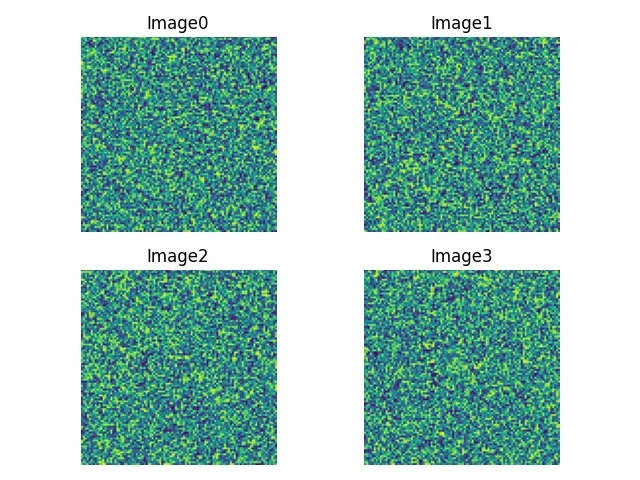
We can define a function based on the subplots command which creates a number of axes in the figures, according to the number of rows and columns, and then iterates over the list of the axis to plot images adding a title for each of them.
import numpy as np
import matplotlib.pyplot as plt


def display_multiple_img(images, rows=1, cols=1):
    figure, ax = plt.subplots(nrows=rows, ncols=cols)
    for ind, title in enumerate(images):
        ax.ravel()[ind].imshow(images[title])
        ax.ravel()[ind].set_title(title)
        ax.ravel()[ind].set_axis_off()
    plt.tight_layout()
    plt.show()


total_images = 4
images = {"Image" + str(i): np.random.rand(100, 100) for i in range(total_images)}

display_multiple_img(images, 2, 2)
Output:

Suraj Joshi is a backend software engineer at Matrice.ai.
LinkedIn