如何在 Matplotlib 中一個圖中正確顯示多個影象
Suraj Joshi
2024年2月15日
Matplotlib
Matplotlib Image

在圖形中顯示多個影象的核心思想是遍歷軸列表以繪製單個影象。我們使用 imshow()方法顯示單個影象。
在 for 迴圈中使用 Matplotlib add_subplot()
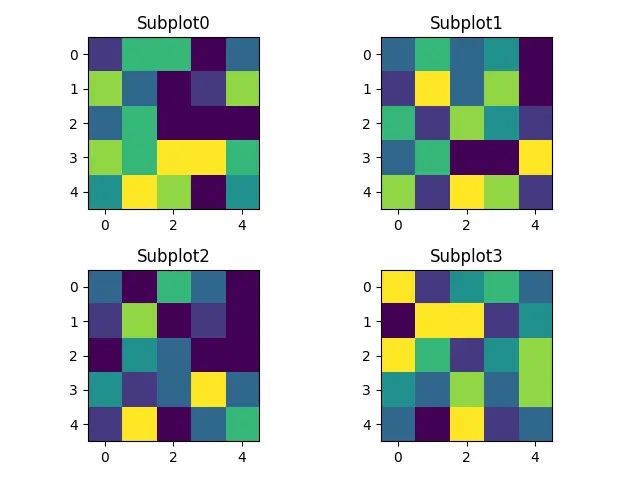
在一個圖中顯示多個影象的最簡單方法可能是使用 add_subplot() 啟動子圖並使用 imshow() 方法顯示每個影象,並在 for 迴圈中顯示影象。
add_subplot() 方法的語法:
add_subplot(rows, columns, i)
其中 rows 和 columns 代表合成圖中行和列的總數,i 代表要顯示的影象的索引。
import numpy as np
import matplotlib.pyplot as plt

width = 5
height = 5
rows = 2
cols = 2
axes = []
fig = plt.figure()

for a in range(rows * cols):
    b = np.random.randint(7, size=(height, width))
    axes.append(fig.add_subplot(rows, cols, a + 1))
    subplot_title = "Subplot" + str(a)
    axes[-1].set_title(subplot_title)
    plt.imshow(b)
fig.tight_layout()
plt.show()
輸出:
我們可以在上面的程式碼中增加更多的靈活性,以在選定的軸上繪製更多特徵,並提供對子圖的每個軸的訪問。
import numpy as np
import matplotlib.pyplot as plt

width = 5
height = 5
rows = 2
cols = 2
fig = plt.figure()

x = np.linspace(-3, 3, 100)
y1 = np.sin(x)
y2 = 1 / (1 + np.exp(-x))

axes = []

for i in range(cols * rows):
    b = np.random.randint(10, size=(height, width))
    axes.append(fig.add_subplot(rows, cols, i + 1))
    subplot_title = "Subplot" + str(i)
    axes[-1].set_title(subplot_title)
    plt.imshow(b)

axes[1].plot(x, y1)
axes[3].plot(x, y2)
fig.tight_layout()

plt.show()
輸出:
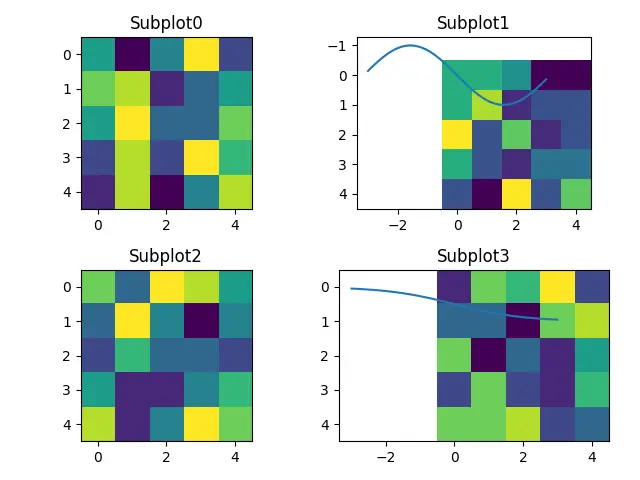
在這裡,axes 允許訪問操作每個子圖。
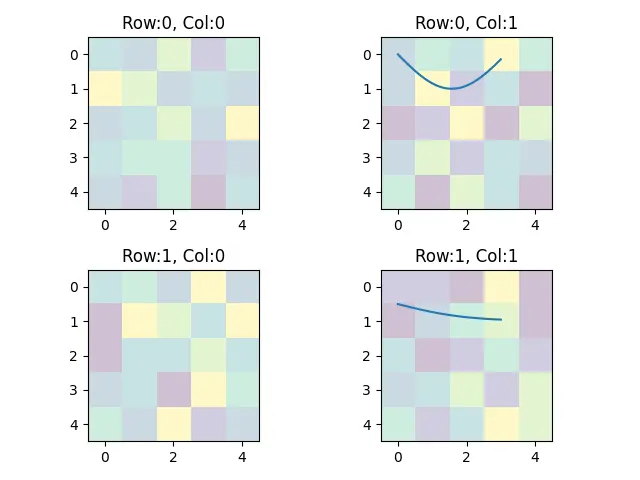
另外,我們還可以通過 [row_index][column_index] 提供對每個子圖的訪問許可權,當我們具有多個影象陣列時,這將更為有用。
import numpy as np
import matplotlib.pyplot as plt

width = 5
height = 5
rows = 2
cols = 2

x = np.linspace(0, 3, 100)
y1 = np.sin(x)
y2 = 1 / (1 + np.exp(-x))

figure, axes = plt.subplots(nrows=rows, ncols=cols)

for a, b in enumerate(axes.flat):
    image = np.random.randint(7, size=(height, width))
    b.imshow(image, alpha=0.25)
    r = a // cols
    c = a % cols
    subtitle = "Row:" + str(r) + ", Col:" + str(c)
    b.set_title(subtitle)

axes[0][1].plot(x, y1)
axes[1][1].plot(x, y2)

figure.tight_layout()
plt.show()
輸出:
根據 Matplotlib 中子圖定義功能
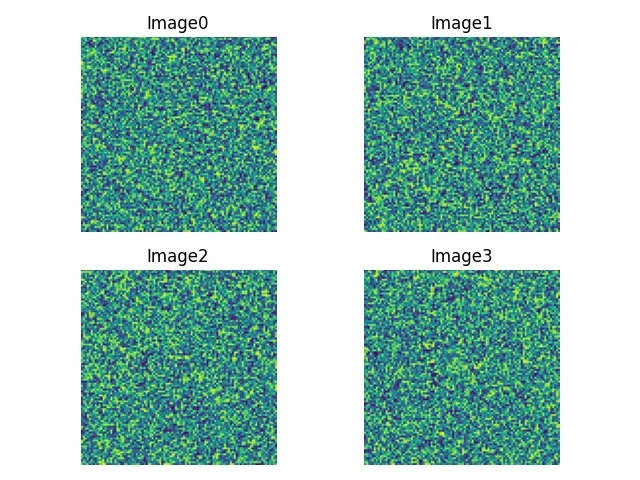
我們可以基於 subplots 命令定義一個函式,該命令會在圖中建立許多軸。根據行和列的數量,然後在軸列表上進行迭代以繪製影象,併為每個影象新增標題。
import numpy as np
import matplotlib.pyplot as plt


def display_multiple_img(images, rows=1, cols=1):
    figure, ax = plt.subplots(nrows=rows, ncols=cols)
    for ind, title in enumerate(images):
        ax.ravel()[ind].imshow(images[title])
        ax.ravel()[ind].set_title(title)
        ax.ravel()[ind].set_axis_off()
    plt.tight_layout()
    plt.show()


total_images = 4
images = {"Image" + str(i): np.random.rand(100, 100) for i in range(total_images)}

display_multiple_img(images, 2, 2)
輸出:
Enjoying our tutorials? Subscribe to DelftStack on YouTube to support us in creating more high-quality video guides. Subscribe
作者: Suraj Joshi

Suraj Joshi is a backend software engineer at Matrice.ai.
LinkedIn