Matplotlib で 1つの図に複数の画像を正しく表示する方法
Suraj Joshi
2023年1月30日
Matplotlib
Matplotlib Image

図に複数の画像を表示します。ための核となるアイデアは、軸のリストを繰り返し処理して個々の画像をプロットすることです。個々の画像を表示します。には、imshow() メソッドを使用します。
for ループで add_subplot() を使用する
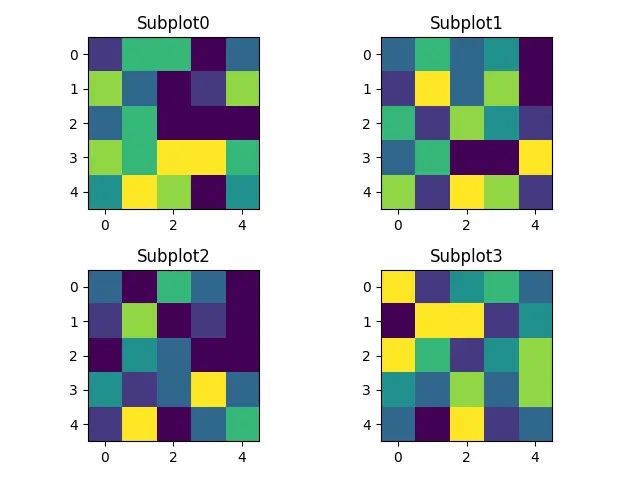
図に複数の画像を表示します。最も簡単な方法は、add_subplot() を使用してすべての画像を表示してサブプロットを開始し、imshow() メソッドを使用して画像を for ループ内に表示します。ことです。
add_subplot() メソッドの構文:
add_subplot(rows, columns, i)
ここで、rows と columns は合成図の行と列の総数を表し、i は表示される画像のインデックスを表します。
import numpy as np
import matplotlib.pyplot as plt

width = 5
height = 5
rows = 2
cols = 2
axes = []
fig = plt.figure()

for a in range(rows * cols):
    b = np.random.randint(7, size=(height, width))
    axes.append(fig.add_subplot(rows, cols, a + 1))
    subplot_title = "Subplot" + str(a)
    axes[-1].set_title(subplot_title)
    plt.imshow(b)
fig.tight_layout()
plt.show()
出力:
上記のコードに柔軟性を追加して、選択した軸にさらに多くの特徴をプロットし、サブプロットの各軸にアクセスできるようにすることができます。
import numpy as np
import matplotlib.pyplot as plt

width = 5
height = 5
rows = 2
cols = 2
fig = plt.figure()

x = np.linspace(-3, 3, 100)
y1 = np.sin(x)
y2 = 1 / (1 + np.exp(-x))

axes = []

for i in range(cols * rows):
    b = np.random.randint(10, size=(height, width))
    axes.append(fig.add_subplot(rows, cols, i + 1))
    subplot_title = "Subplot" + str(i)
    axes[-1].set_title(subplot_title)
    plt.imshow(b)

axes[1].plot(x, y1)
axes[3].plot(x, y2)
fig.tight_layout()

plt.show()
出力:
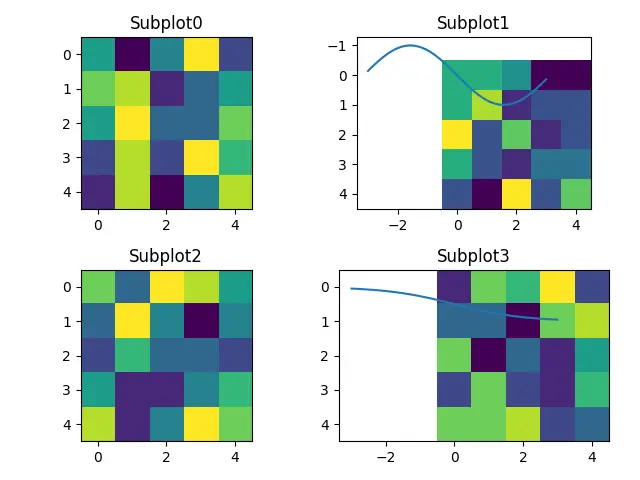
ここで、axes を使用すると、各サブプロットを操作できます。
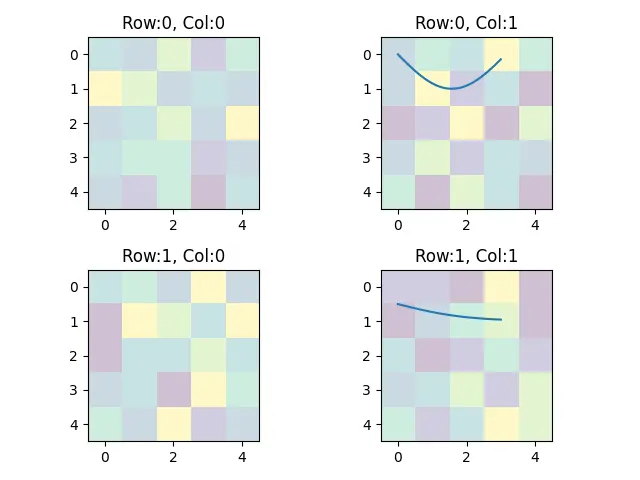
あるいは、[row_index][column_index] を使用して各サブプロットへのアクセスを提供することもできます。これは、複数の画像の配列がある場合により役立ちます。
import numpy as np
import matplotlib.pyplot as plt

width = 5
height = 5
rows = 2
cols = 2

x = np.linspace(0, 3, 100)
y1 = np.sin(x)
y2 = 1 / (1 + np.exp(-x))

figure, axes = plt.subplots(nrows=rows, ncols=cols)

for a, b in enumerate(axes.flat):
    image = np.random.randint(7, size=(height, width))
    b.imshow(image, alpha=0.25)
    r = a // cols
    c = a % cols
    subtitle = "Row:" + str(r) + ", Col:" + str(c)
    b.set_title(subtitle)

axes[0][1].plot(x, y1)
axes[1][1].plot(x, y2)

figure.tight_layout()
plt.show()
出力:
subplot に基づいて関数を定義する
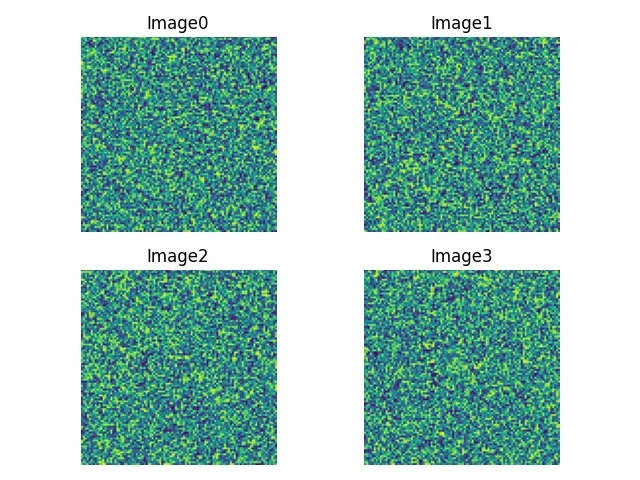
subplot コマンドに基づいて、図にいくつかの軸を作成する関数を定義できます。行と列の数に応じて、軸のリストを繰り返し処理し、それぞれにタイトルを追加して画像をプロットします。
import numpy as np
import matplotlib.pyplot as plt


def display_multiple_img(images, rows=1, cols=1):
    figure, ax = plt.subplots(nrows=rows, ncols=cols)
    for ind, title in enumerate(images):
        ax.ravel()[ind].imshow(images[title])
        ax.ravel()[ind].set_title(title)
        ax.ravel()[ind].set_axis_off()
    plt.tight_layout()
    plt.show()


total_images = 4
images = {"Image" + str(i): np.random.rand(100, 100) for i in range(total_images)}

display_multiple_img(images, 2, 2)
出力:
チュートリアルを楽しんでいますか? <a href="https://www.youtube.com/@delftstack/?sub_confirmation=1" style="color: #a94442; font-weight: bold; text-decoration: underline;">DelftStackをチャンネル登録</a> して、高品質な動画ガイドをさらに制作するためのサポートをお願いします。 Subscribe
著者: Suraj Joshi

Suraj Joshi is a backend software engineer at Matrice.ai.
LinkedIn