How to Debug JavaScript Code With Visual Studio IDE on Chrome
- Debug JavaScript Code With Microsoft Visual Studio IDE on Chrome
- Add Breakpoints Inside the JavaScript Code for Debugging
- Add Test Inside the Microsoft Visual Studio for Debugging
- Check for Hardware Usage Using Performance Profiler
- Conclusion
The Microsoft Visual Studio is an Integrated Development Environment (IDE) code editor in which you can develop various types of applications like web apps, mobile apps, desktop apps, and cloud that can run on various devices.
It supports various programming languages like C++, C#, JavaScript, Python, etc.
Debugging is a process of removing bugs from the code. This tutorial will show how we can debug our JavaScript code using the MS Visual Studio IDE on the Chrome browser.
Debug JavaScript Code With Microsoft Visual Studio IDE on Chrome
- Make sure that you’ve installed the Microsoft Visual Studio (any version) on your system.
- Open the software.
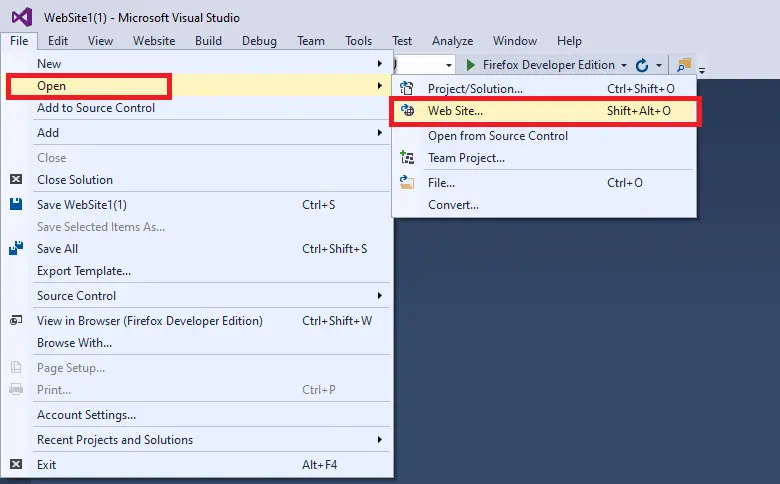
- Click the
Filemenu, then selectOpenfrom the dropdown. - Select
Web Site. - Select the location where you have stored your project and then open it.
If you don’t have an ASP.NET project ready, you can create a new project.
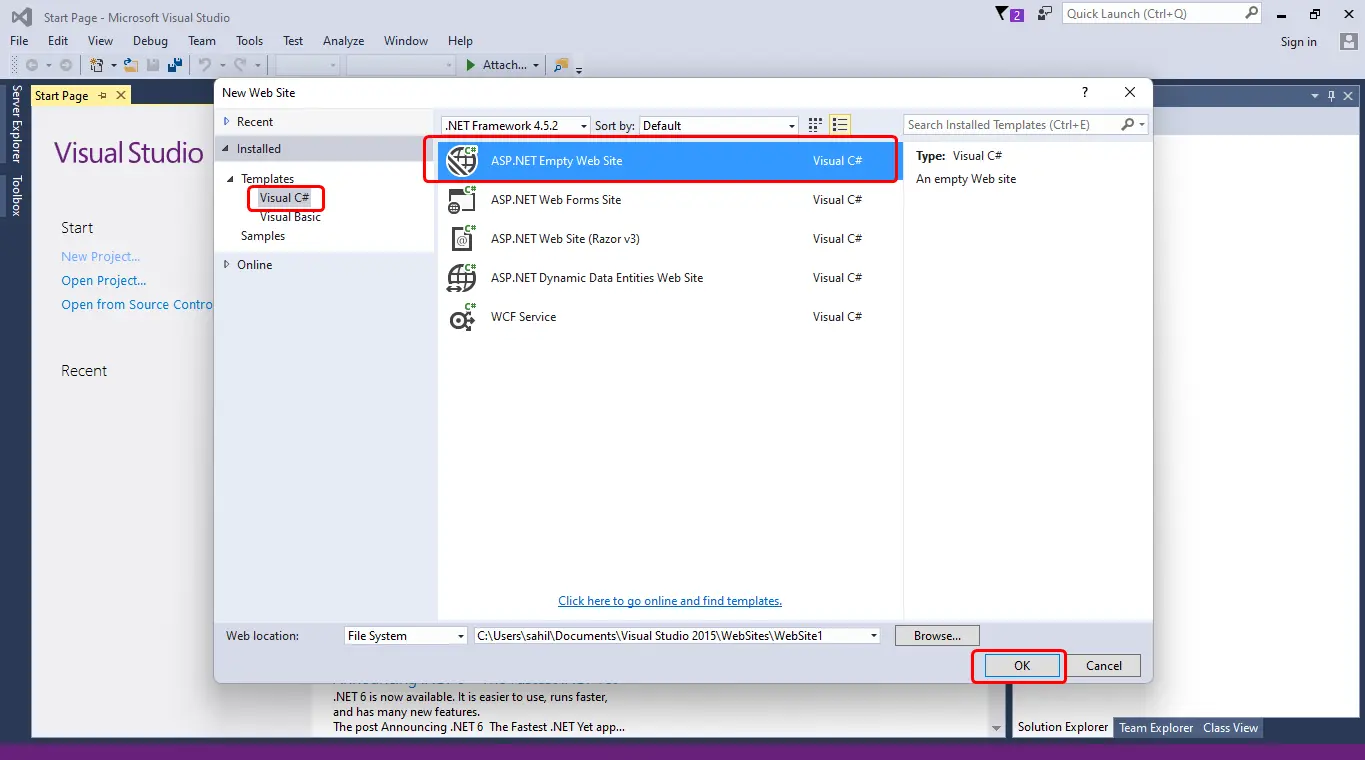
- Click on “File”, select “New”.
- Choose the “Web Site” option from the dropdown.
- A dialog box opens, where you have to select “ASP.NET Empty Web Site”, then click OK.
We have already created a sample project for demonstration purposes for this example. The project currently only has an HTML and a JavaScript file.
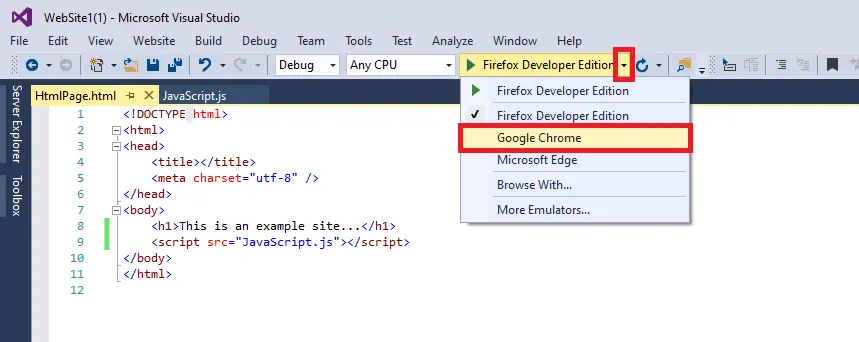
Our purpose is to run the code on the Chrome browser and debug the code with the help of MS Visual Studio. So, now we will first select the Chrome browser.
- We have to click on the down arrow from the menu.
- Choose the “Google Chrome” browser from the dropdown list.
- Click on the green Play button beside the browser name to open up a new Chrome browser window and then it will run the website which you have created.
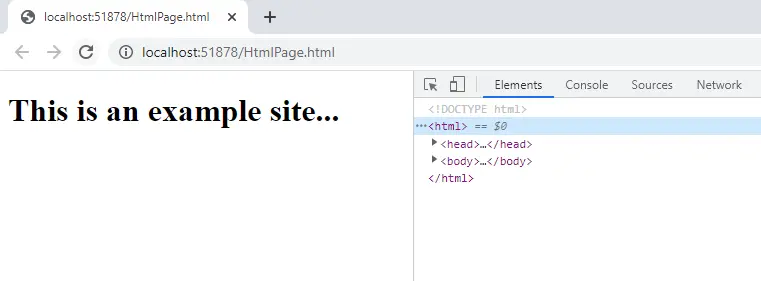
Now that your website is currently running on the localhost, you can start the debugging by adding various breakpoints, creating tests, analyzing code, checking the code’s performance, etc.
Add Breakpoints Inside the JavaScript Code for Debugging
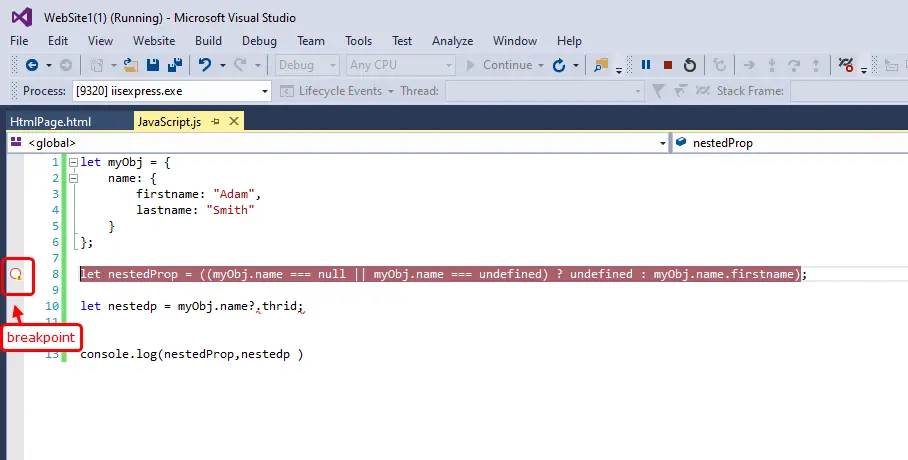
To add a breakpoint, we have to click on the blue area at the corner left of the screen, as shown below. You can add any number of breakpoints inside your program.
The breakpoints in programming allow a developer to stop or pause the program in the middle of execution. After the program is paused, you check for values of the variables, the output on the screen, etc., and then you can start executing the remaining part of the code.
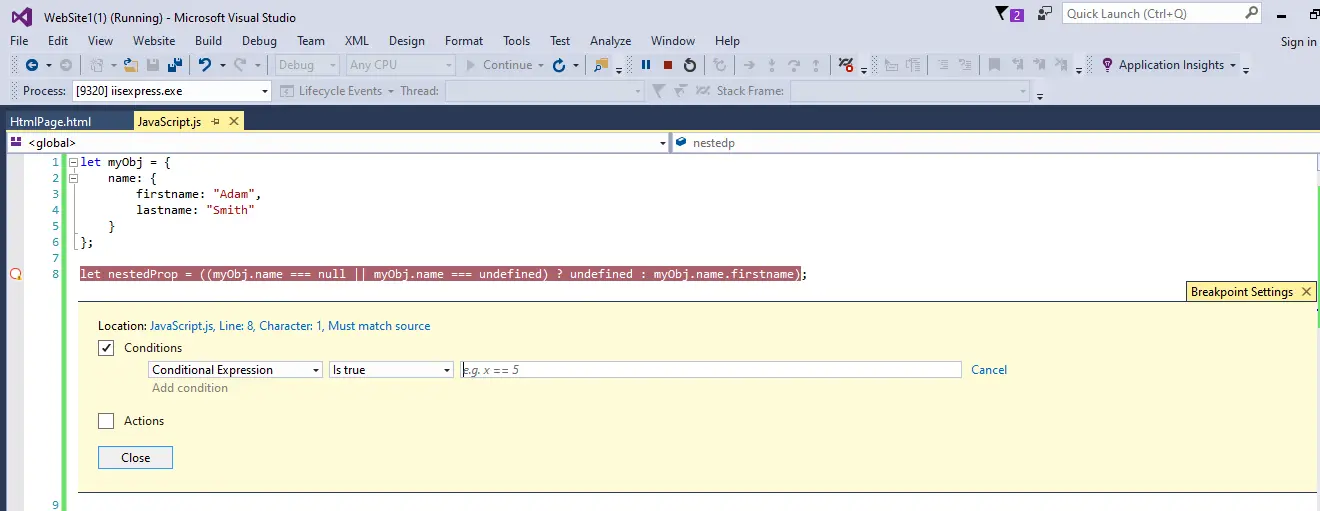
You can also click on the breakpoint and add conditions or actions to get more information about how to code is working.
Add Test Inside the Microsoft Visual Studio for Debugging
The Microsoft Visual Studio also allows you to write your test cases and execute them inside the IDE. This can be done under the “Test” tab inside the IDE.
Check for Hardware Usage Using Performance Profiler
The good thing about using an IDE is that it comes integrated with all the tools needed for debugging. Out of these tools, the performance profiler tool allows you to check how much memory or hardware resource your code is consuming.
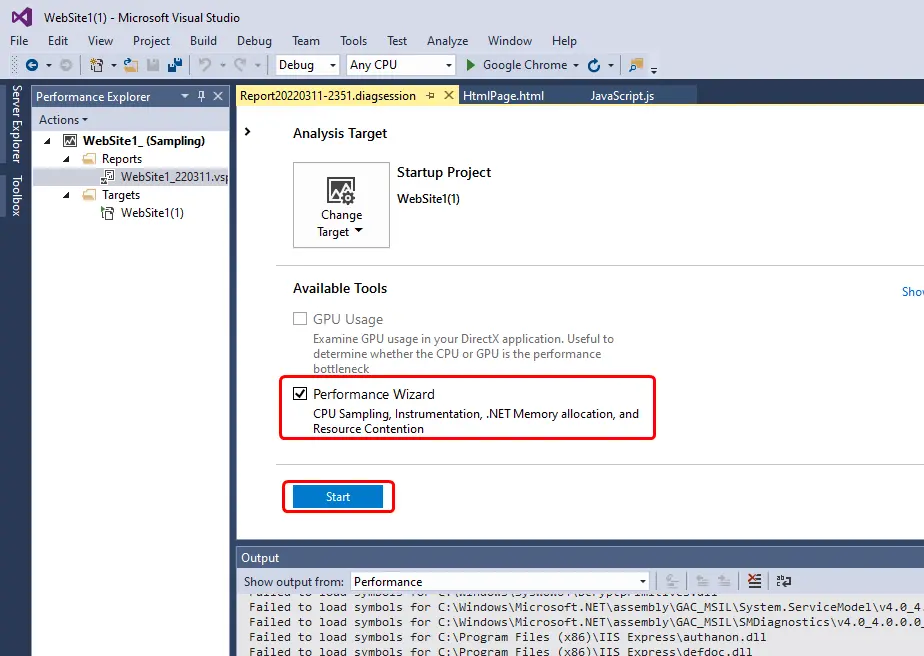
- To open the “Performance Profiler” tool, click on the “Analyze” tab and select “Performance Profiler”. This opens a new window where you need to select the performance usage on the GPU or the CPU.
- In this case, we will check for CPU usage and select the “Performance Wizard” checkbox.
- Lastly, click on the start to run the “Performance Profiler” tool.
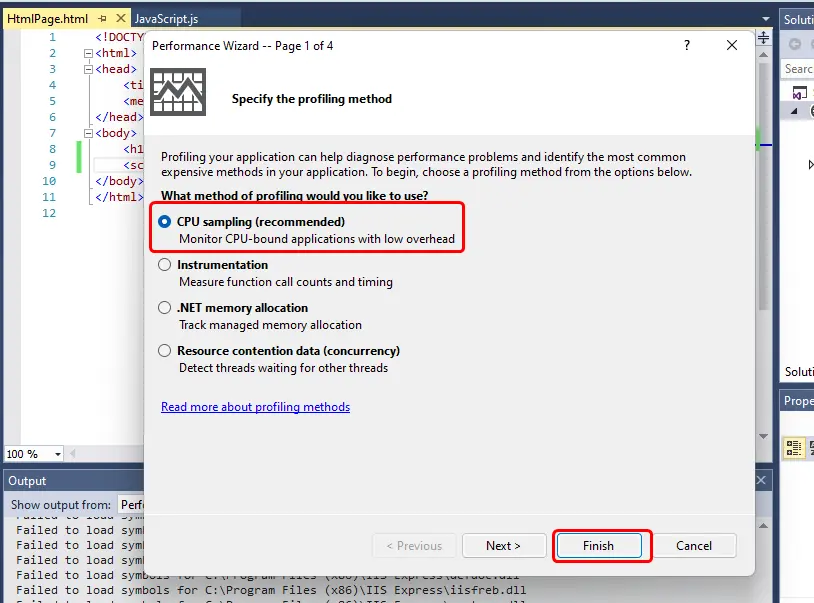
It’ll open a new dialog box where it will ask you to select any one option from the list. Here, we will select the “CPU sampling” option (which is a recommended option as well) and then click Finish.
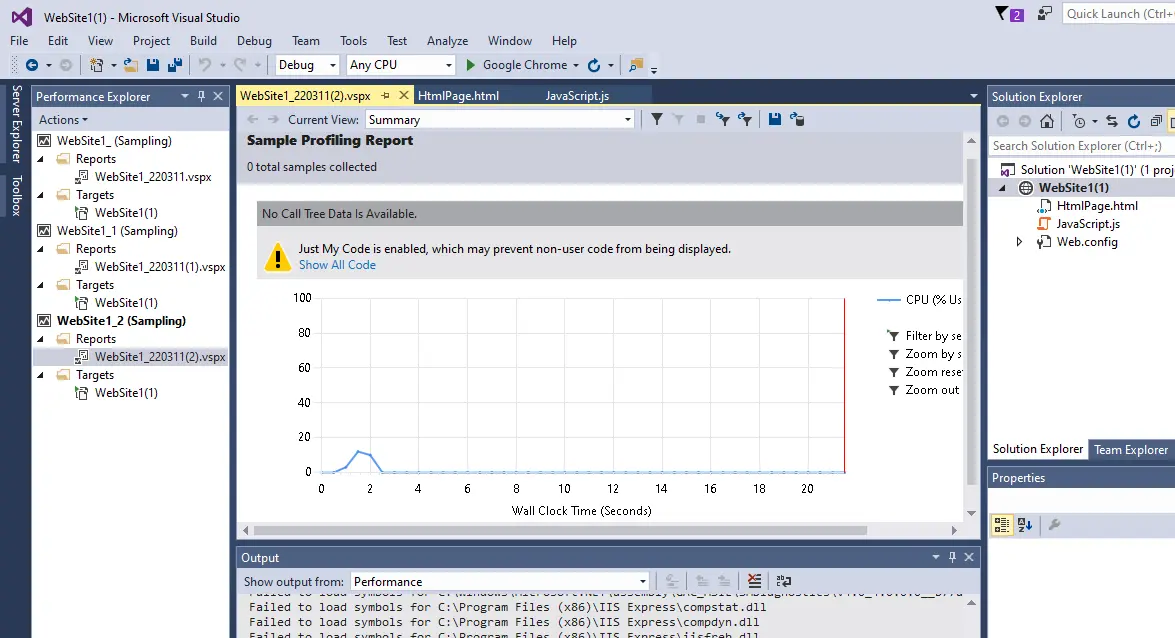
It will start the profiler tool and generate a “Sample Profiling Report”, which will show you the CPU usage as shown below.
We have now explored some of the debugging tools and techniques available inside the MS Visual Studio IDE, but there are other tools that you can use for debugging and enhancing the quality of your JavaScript code. For more information, read Microsoft Visual Studio IDE.
Conclusion
The Microsoft Visual Studio is a great and heavy IDE for building, executing, and debugging code. It has support for various programming languages, including JavaScript.
We can easily write and debug our JavaScript code inside the IDE and take advantage of various other debugging tools available in the IDE. For tips and tricks related to debugging, visit this link.

Sahil is a full-stack developer who loves to build software. He likes to share his knowledge by writing technical articles and helping clients by working with them as freelance software engineer and technical writer on Upwork.
LinkedIn