Python NumPy numpy.histogram() Function
-
Syntax of
numpy.histogram() -
Example Codes:
numpy.histogram() -
Example Codes:
numpy.histogram()to Specify the Number and Size of Bins -
Example Codes:
numpy.histogram()to Use thedensityParameter -
Example Codes:
numpy.histogram()to Plot the Histogram
Python NumPy numpy.histogram() function generates the values of a histogram. It doesn’t plot a histogram but it computes its values. We pass an array as a parameter. This function computes its histogram and returns an array that has stored histogram values. We can say that it returns the numeric representation of a histogram.
Syntax of numpy.histogram()
numpy.histogram(a, bins=10, range=None, normed=None, weights=None, density=None)
Parameters
a |
It is an array_like structure. It represents the input data to compute the histogram. |
bins |
It is an integer, string, or sequence of scalars. It represents the number of bins. A bin is like a range, for example, 0-5, 6-10, etc. If bins is an integer then it represents the number of equally spaced bins. If it is a string then it represents the method to calculate the bin space. If it is a sequence then it represents the bins with different widths. |
range |
It is the range given in a floating point number. It represents the upper and the lower range of the bins. If the range is not given then [a.min(), a.max()] is the range. |
normed |
It is a boolean parameter. Its function is like the density parameter but if the bins are not equally spaced it generates incorrect results. |
weights |
It is an array_like structure. Its size is the same as a. If the density is True then the weights are normalized. |
density |
It is a boolean parameter. If its value is True then it computes the probability rather than computing the frequency. |
Return
It returns two arrays: hist and bin_edges. The array hist shows the values of the histogram and bin_edges shows the bin edges. The size of bin_edges is always 1 + (size of hist) i.e length(hist)+1.
Example Codes: numpy.histogram()
The parameter a is a mandatory parameter. If we execute this function without passing the number of bins then it will compute ten bins with unequal spaces.
import numpy as np

a = np.array(
    [89, 34, 56, 87, 90, 23, 45, 12, 65, 78, 9, 34, 12, 11, 2, 65, 78, 82, 28, 78]
)

histogram = np.histogram(a)
print(histogram)
Output:
(
    array([2, 3, 2, 2, 1, 0, 1, 2, 3, 4], dtype=int64),
    array([2.0, 10.8, 19.6, 28.4, 37.2, 46.0, 54.8, 63.6, 72.4, 81.2, 90.0]),
)
Example Codes: numpy.histogram() to Specify the Number and Size of Bins
We will specify the number of bins first.
import numpy as np

a = np.array(
    [89, 34, 56, 87, 90, 23, 45, 12, 65, 78, 9, 34, 12, 11, 2, 65, 78, 82, 28, 78]
)

histogram = np.histogram(a, bins=2)
print(histogram)
Output:
(array([10, 10], dtype=int64), array([ 2., 46., 90.]))
The above code has computed a histogram that has 2 bins. The bins are [2., 46.) and [46., 90.).
Now, we will specify the edge of the bins.
import numpy as np

a = np.array(
    [89, 34, 56, 87, 90, 23, 45, 12, 65, 78, 9, 34, 12, 11, 2, 65, 78, 82, 28, 78]
)

histogram = np.histogram(a, bins=[0, 30, 60, 90])
print(histogram)
Output:
(array([7, 4, 9]), array([0, 30, 60, 90]))
Example Codes: numpy.histogram() to Use the density Parameter
import numpy as np

a = np.array(
    [89, 34, 56, 87, 90, 23, 45, 12, 65, 78, 9, 34, 12, 11, 2, 65, 78, 82, 28, 78]
)

histogram = np.histogram(a, bins=5, density=True)
print(histogram)
Output:
(array([ 0.01420455,  0.01136364,  0.00284091,  0.00852273,  0.01988636]),
 array([  2. ,  19.6,  37.2,  54.8,  72.4,  90. ]))
Note that instead of computing histogram values, the function generates the probability.
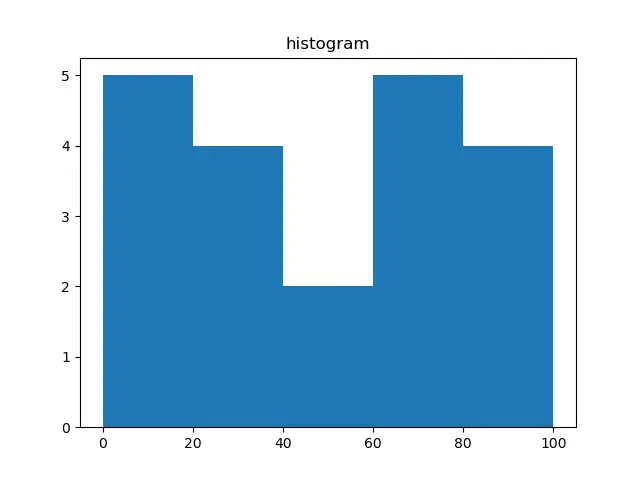
Example Codes: numpy.histogram() to Plot the Histogram
We can plot the histogram using pyplot.
from matplotlib import pyplot as plt
import numpy as np

a = np.array(
    [89, 34, 56, 87, 90, 23, 45, 12, 65, 78, 9, 34, 12, 11, 2, 65, 78, 82, 28, 78]
)

plt.hist(a, bins=[0, 20, 40, 60, 80, 100])
plt.title("histogram")
plt.show()
Output: