Python NumPy numpy.histogram() 関数
Minahil Noor
2023年1月30日
NumPy
-
numpy.histogram()の構文 -
コード例:
numpy.histogram() -
コード例:
numpy.histogram()でビンの数とサイズを指定する -
コード例:
densityパラメータを用いるnumpy.histogram()の例 -
コード例:ヒストグラムをプロットするための
numpy.histogram()
Python NumPy numpy.histogram() 関数はヒストグラムの値を生成します。ヒストグラムをプロットするわけではありませんが、その値を計算します。パラメータとして配列を渡します。この関数は、ヒストグラムを計算し、ヒストグラムの値を格納した配列を返します。これはヒストグラムの数値表現を返すと言ってもよいでしょう。
numpy.histogram() の構文
numpy.histogram(a, bins=10, range=None, normed=None, weights=None, density=None)
パラメータ
a |
これは array_like 構造体です。これはヒストグラムを計算するための入力データを表します。 |
bins |
これは整数、文字列、またはスカラーのシーケンスです。これはビンの数を表す。ビンは範囲のようなもので、例えば 0-5, 6-10 などです。bins が整数の場合は、等間隔に配置されたビンの数を表す。文字列であれば、ビンの空間を計算する方法を表す。シーケンスであれば、幅の異なるビンを表します。 |
range |
これは浮動小数点数で与えられた範囲です。これは bins の上限と下限の範囲を表します。範囲が指定されていない場合は、[a.min(), a.max()] が範囲となります。 |
normed |
これはブール値のパラメータです。この関数は density パラメータと似ていますが、ビンの間隔が等間隔でない場合は正しくない結果を生成します。 |
weights |
これは array_like 構造体です。サイズは a と同じです。density が True の場合、重みは正規化されます。 |
density |
これはブール値のパラメータです。値が True の場合、頻度を計算するのではなく確率を計算します。 |
戻り値
これは 2つの配列を返します。hist と bin_edges です。配列 hist はヒストグラムの値を示し、bin_edges はビンエッジを示します。bin_edges のサイズは常に 1 + (hist のサイズ)、つまり length(hist)+1 です。
コード例:numpy.histogram()
パラメータ a は必須のパラメータです。ビンの数を渡さずにこの関数を実行すると、不等間隔のビンを 10 個計算します。
import numpy as np

a = np.array(
    [89, 34, 56, 87, 90, 23, 45, 12, 65, 78, 9, 34, 12, 11, 2, 65, 78, 82, 28, 78]
)

histogram = np.histogram(a)
print(histogram)
出力:
(
    array([2, 3, 2, 2, 1, 0, 1, 2, 3, 4], dtype=int64),
    array([2.0, 10.8, 19.6, 28.4, 37.2, 46.0, 54.8, 63.6, 72.4, 81.2, 90.0]),
)
コード例:numpy.histogram() でビンの数とサイズを指定する
最初にビンの数を指定します。
import numpy as np

a = np.array(
    [89, 34, 56, 87, 90, 23, 45, 12, 65, 78, 9, 34, 12, 11, 2, 65, 78, 82, 28, 78]
)

histogram = np.histogram(a, bins=2)
print(histogram)
出力:
(array([10, 10], dtype=int64), array([ 2., 46., 90.]))
上のコードは 2つのビンを持つヒストグラムを計算します。ビンは [2., 46.) と [46., 90.) です。
ここで、ビンの辺を指定します。
import numpy as np

a = np.array(
    [89, 34, 56, 87, 90, 23, 45, 12, 65, 78, 9, 34, 12, 11, 2, 65, 78, 82, 28, 78]
)

histogram = np.histogram(a, bins=[0, 30, 60, 90])
print(histogram)
出力:
(array([7, 4, 9]), array([0, 30, 60, 90]))
コード例:density パラメータを用いる numpy.histogram() の例
import numpy as np

a = np.array(
    [89, 34, 56, 87, 90, 23, 45, 12, 65, 78, 9, 34, 12, 11, 2, 65, 78, 82, 28, 78]
)

histogram = np.histogram(a, bins=5, density=True)
print(histogram)
出力:
(array([ 0.01420455,  0.01136364,  0.00284091,  0.00852273,  0.01988636]),
 array([  2. ,  19.6,  37.2,  54.8,  72.4,  90. ]))
ヒストグラムの値を計算する代わりに、この関数は確率を生成することに注意してください。
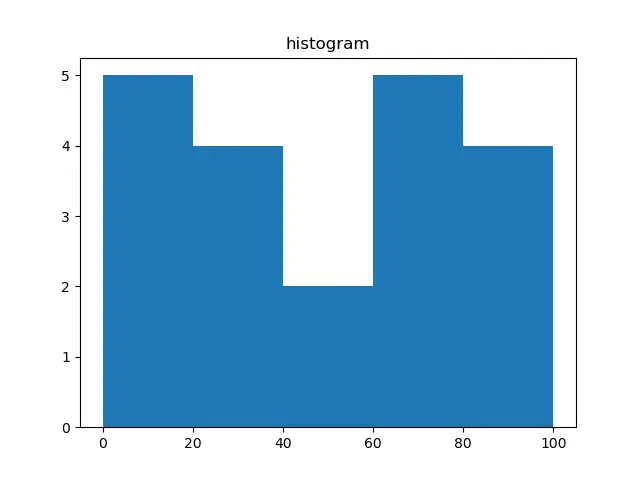
コード例:ヒストグラムをプロットするための numpy.histogram()
ヒストグラムをプロットするには、pyplot を使用します。
from matplotlib import pyplot as plt
import numpy as np

a = np.array(
    [89, 34, 56, 87, 90, 23, 45, 12, 65, 78, 9, 34, 12, 11, 2, 65, 78, 82, 28, 78]
)

plt.hist(a, bins=[0, 20, 40, 60, 80, 100])
plt.title("histogram")
plt.show()
出力:
チュートリアルを楽しんでいますか? <a href="https://www.youtube.com/@delftstack/?sub_confirmation=1" style="color: #a94442; font-weight: bold; text-decoration: underline;">DelftStackをチャンネル登録</a> して、高品質な動画ガイドをさらに制作するためのサポートをお願いします。 Subscribe