跳到內容
選單
探索主題
教程列表
技巧貼士
函數參考
正體中文
⌄
正體中文
简体中文
Español
Français
Deutsche
日本語
English
首頁
→
How-to 指南
→
Plotly 貼士
實用解決方案
Plotly 貼士 實用指南
解決問題,繼續建構。 Python Plotly 操作方法文章集
找到你需要的答案
依照工作任務分類瀏覽實用解決方案。
搜尋此頁面
此頁面有 __COUNT__ 個項目
Plotly Plot
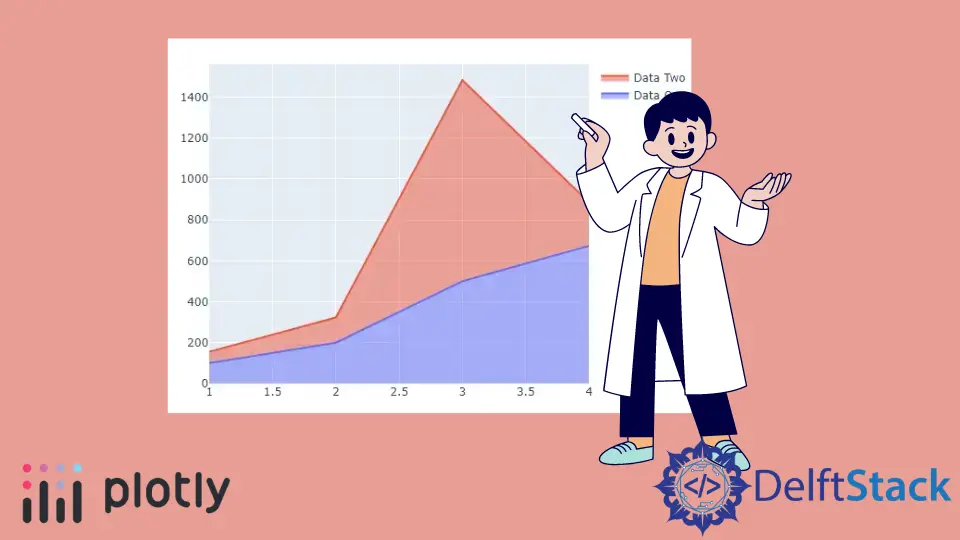
Plotly 疊加面積圖
可以使用 Plotly 的 scatter() 函式的 stackgroup 引數建立堆積面積圖。
↗
Plotly Plot
Plotly 樹狀圖
本文教你在 Python 中使用 Plotly 的 treemap() 函式建立樹狀圖。
↗
Plotly Plot
Plotly 箱型圖
使用 Plotly 的 box() 函式建立箱型圖。
↗
Plotly Plot
Plotly 熱圖
本文教你在 Python 中使用 Plotly 的 imshow() 和 Heatmap() 函式建立熱圖。
↗
Plotly Map
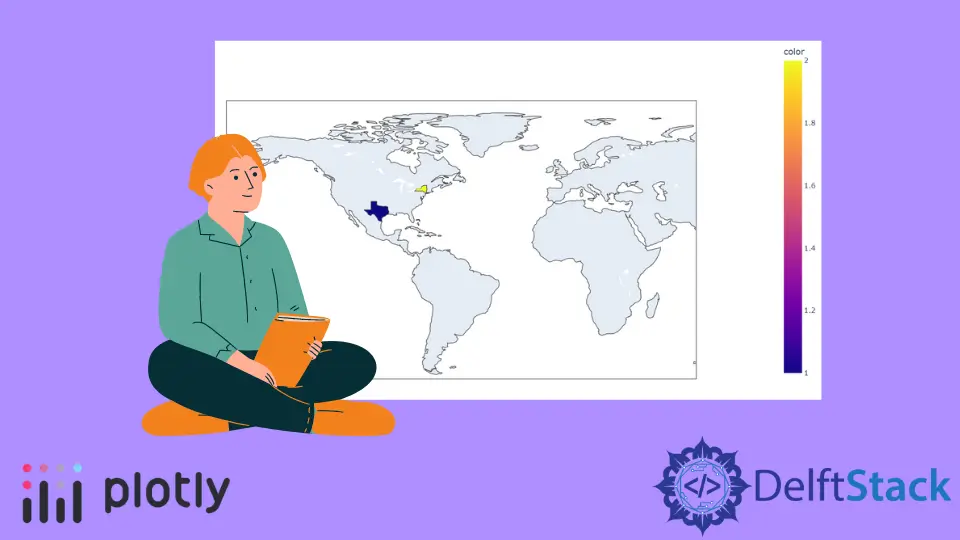
Plotly 等值線圖
本文教你在 Python 中使用 Plotly 的 choropleth() 函式建立等值線圖。
↗
Python Plotly
Plotly 氣泡圖
可以使用 plotly 的 scatter() 函式建立氣泡圖。
↗
Plotly Plot
Plotly 桑基圖
可以使用 Plotly 中圖形物件的 Sankey() 函式建立 Sankey 圖。
↗
Plotly Table
Plotly 表
使用 Plotly 圖形物件的 Table() 函式建立一個表。
↗
Plotly Plot
Plotly 直方圖
本文教你在 Python 中使用 Plotly 的 histogram() 函式建立直方圖。
↗
Plotly Plot
plotly 小提琴圖
本文幫助在 Python 中使用 Plotly 的 violin() 函式建立小提琴圖。
↗
Plotly Plot
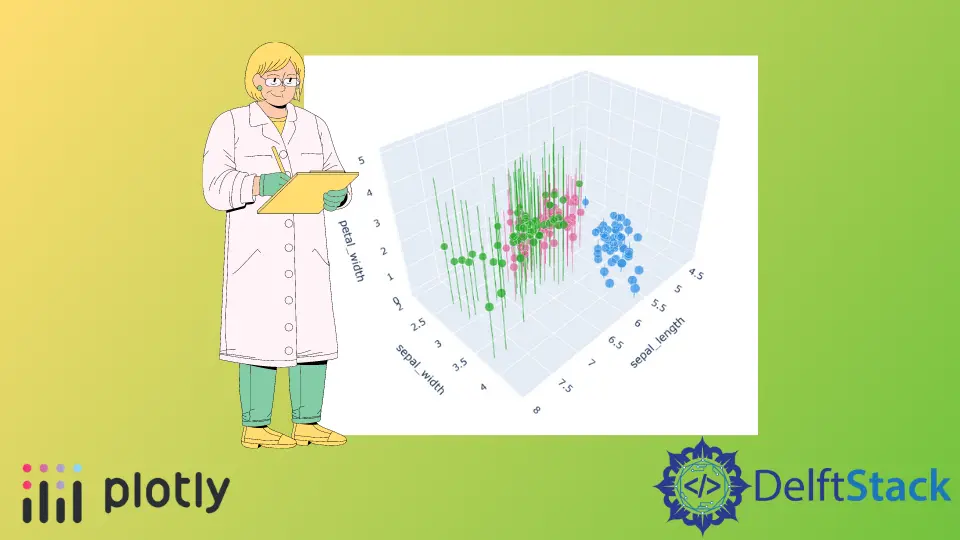
Plotly 3D 散點圖
本文教你在 Python 中使用 Plotly 的 scatter_3d() 函式建立一個 3d 散點圖。
↗
Plotly Plot
Plotly 甘特圖
本文教你在 Python 中使用 Plotly 的 timeline()和 create_gantt()函式建立甘特圖。
↗
Plotly Plot
Plotly 線形圖
本文教你在 Python 中使用 Plotly 的 line() 函式建立折線圖。
↗
Plotly Plot
Plotly 餅圖
使用 plotly 的 pie() 函式建立一個餅圖。
↗
Plotly Plot
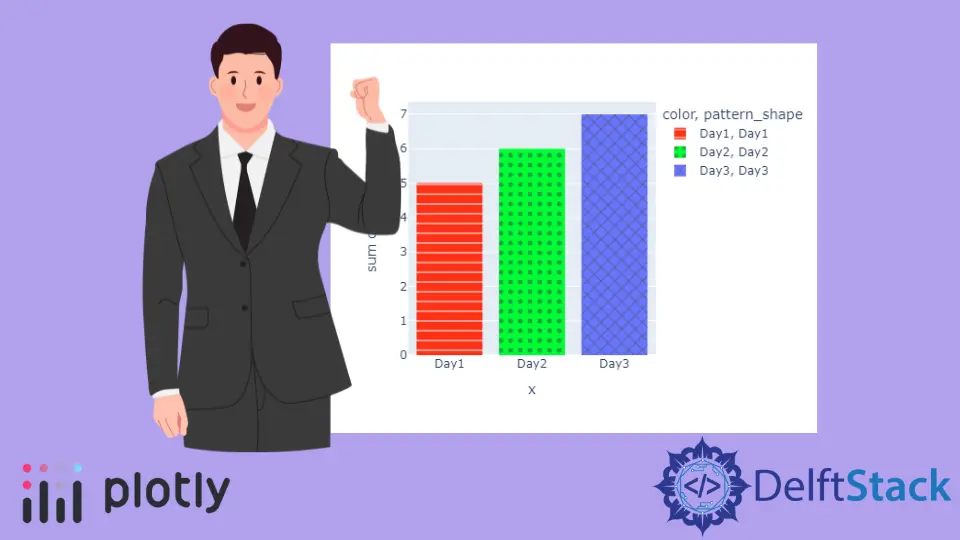
Plotly 條形圖
使用 Plotly 的 bar() 函式建立條形圖。
↗
找不到項目
請嘗試其他搜尋,或清除篩選條件。
清除篩選條件