Plotly 表
Ammar Ali
2024年2月15日
Plotly
Plotly Table

本教程將討論使用 Plotly 圖形物件的 Table() 函式建立表格。
使用 Plotly 建立表
我們可以使用 Plotly 圖形物件的 Table() 函式來建立一個表格。要建立一個基本表格,我們必須使用 Table() 函式的標題和單元格引數來建立表格的標題和單元格。
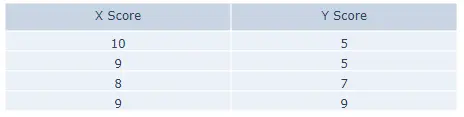
讓我們使用 Plotly 建立一個簡單的表。請參閱下面的程式碼。
import plotly.graph_objects as go

data = [
    go.Table(
        header=dict(values=["X Score", "Y Score"]),
        cells=dict(values=[[10, 9, 8, 9], [5, 5, 7, 9]]),
    )
]

fig = go.Figure(data)
fig.show()
輸出:
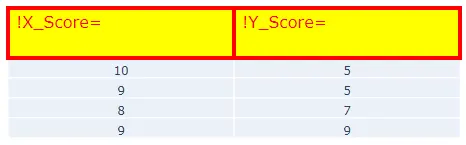
Figure() 函式用於繪製表格。讓我們更改標題的一些屬性。我們可以使用 align 屬性設定文字對齊方式,可以是 left、right 或 auto。
我們可以使用 fill 屬性為標題單元格填充顏色。我們可以使用 font 屬性來設定標題單元格內文字的顏色和大小。
我們可以使用 height 屬性設定標題單元格的高度,並將其值設定為整數。使用 line 引數,我們可以設定線條屬性,如線條顏色和寬度。我們可以新增字首和字尾,它們會出現在單元格值的前後。
讓我們更改上面提到的屬性。請參閱下面的程式碼。
import plotly.graph_objects as go

data = [
    go.Table(
        header=dict(
            values=["X_Score", "Y_Score"],
            align="left",
            fill=dict(color="yellow"),
            font=dict(color="red", size=16),
            height=50,
            line=dict(color="red", width=4),
            prefix="!",
            suffix="=",
        ),
        cells=dict(values=[[10, 9, 8, 9], [5, 5, 7, 9]]),
    )
]

fig = go.Figure(data)
fig.show()
輸出:
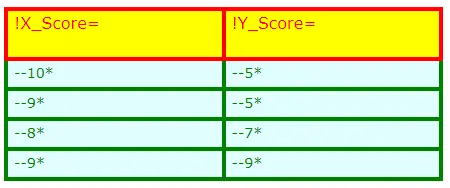
讓我們更改單元格的一些屬性。也可以為單元格更改上述屬性。
讓我們更改上面提到的單元格屬性。請參閱下面的程式碼。
import plotly.graph_objects as go

data = [
    go.Table(
        header=dict(
            values=["X_Score", "Y_Score"],
            align="left",
            fill=dict(color="yellow"),
            font=dict(color="red", size=16),
            height=50,
            line=dict(color="red", width=4),
            prefix="!",
            suffix="=",
        ),
        cells=dict(
            values=[[10, 9, 8, 9], [5, 5, 7, 9]],
            align="left",
            fill=dict(color="lightcyan"),
            font=dict(color="green", size=14),
            height=30,
            line=dict(color="green", width=4),
            prefix="--",
            suffix="*",
        ),
    )
]

fig = go.Figure(data)
fig.show()
輸出:
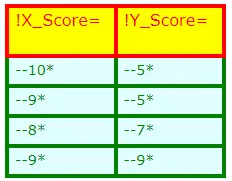
我們可以使用 Table() 函式中的 domain 引數來設定表格域,例如使用 x 軸域的 x 屬性和 y 軸的 y 屬性來設定單元格的寬度。
讓我們在上表中設定單元格的水平大小。請參閱下面的程式碼。
import plotly.graph_objects as go

data = [
    go.Table(
        header=dict(
            values=["X_Score", "Y_Score"],
            align="left",
            fill=dict(color="yellow"),
            font=dict(color="red", size=16),
            height=50,
            line=dict(color="red", width=4),
            prefix="!",
            suffix="=",
        ),
        cells=dict(
            values=[[10, 9, 8, 9], [5, 5, 7, 9]],
            align="left",
            fill=dict(color="lightcyan"),
            font=dict(color="green", size=14),
            height=30,
            line=dict(color="green", width=4),
            prefix="--",
            suffix="*",
        ),
        domain=dict(x=[0, 0.5]),
    )
]

fig = go.Figure(data)
fig.show()
輸出:
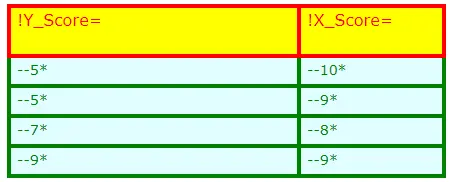
我們還可以使用 columnorder 引數設定列順序,使用 columnwidth 引數設定列寬。
讓我們在第二列中顯示第一列,在第一列中顯示第二列,讓我們更改列寬並將第一列的寬度設定為一半。請參閱下面的程式碼。
import plotly.graph_objects as go

data = [
    go.Table(
        columnorder=[2, 1],
        columnwidth=[1, 2],
        header=dict(
            values=["X_Score", "Y_Score"],
            align="left",
            fill=dict(color="yellow"),
            font=dict(color="red", size=16),
            height=50,
            line=dict(color="red", width=4),
            prefix="!",
            suffix="=",
        ),
        cells=dict(
            values=[[10, 9, 8, 9], [5, 5, 7, 9]],
            align="left",
            fill=dict(color="lightcyan"),
            font=dict(color="green", size=14),
            height=30,
            line=dict(color="green", width=4),
            prefix="--",
            suffix="*",
        ),
    )
]

fig = go.Figure(data)
fig.show()
輸出:
我們可以使用儲存在資料框中的值來建立表。檢查此連結以獲取有關在 Plotly 中建立表的更多詳細資訊。
Enjoying our tutorials? Subscribe to DelftStack on YouTube to support us in creating more high-quality video guides. Subscribe
作者: Ammar Ali
