HOWTO · Plotly
Plotly 甘特圖
本文教你在 Python 中使用 Plotly 的 timeline()和 create_gantt()函式建立甘特圖。
本頁內容
甘特圖會以水平長條呈現專案排程:每個長條涵蓋一項任務的開始與結束日期。本教學將在 Python 中使用 Plotly,透過 plotly.express 的 timeline() 函式,以及 plotly.figure_factory 的 create_gantt() 函式建立甘特圖,然後調整圖表的色彩、標籤與版面配置。
使用 plotly.express.timeline() 建立甘特圖
timeline() 函式會根據提供三個欄位的記錄建立甘特圖:Task 是表示工作名稱的字串,Start 是開始日期,Finish 是結束日期。將這些欄位名稱分別傳給 x_start、x_end 和 y 引數。Plotly 會自動解析「年-月-日」格式的日期字串。
以下範例以字典串列定義三項工作,並將 color 對應到 Task,讓每個長條使用各自的顏色。fig.write_html() 會將圖表儲存為可在任何瀏覽器開啟的獨立頁面;在 notebook 或互動式工作階段中,則可改用 fig.show() 直接內嵌呈現圖表。
本節中的程式碼以及顯示的標籤或輸出仍為英文。
import plotly.express as px

df = [
    dict(Task="Job A", Start="2022-01-01", Finish="2022-02-28"),
    dict(Task="Job B", Start="2022-03-05", Finish="2022-04-15"),
    dict(Task="Job C", Start="2022-02-20", Finish="2022-05-30"),
]

fig = px.timeline(df, x_start="Start", x_end="Finish", y="Task", color="Task")
fig.write_html("gantt-timeline.html")
儲存的頁面會呈現以下圖表:
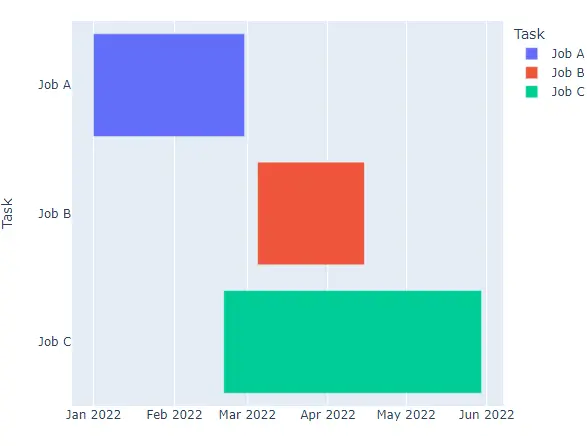
自訂 plotly.express 甘特圖
使用 color_discrete_sequence 引數,將預設調色盤換成 Light24 或 Dark24 等定性色彩序列。
本節中的程式碼以及顯示的標籤或輸出仍為英文。
import plotly.express as px

df = [
    dict(Task="Job A", Start="2022-01-01", Finish="2022-02-28"),
    dict(Task="Job B", Start="2022-03-05", Finish="2022-04-15"),
    dict(Task="Job C", Start="2022-02-20", Finish="2022-05-30"),
]

fig = px.timeline(
    df,
    x_start="Start",
    x_end="Finish",
    y="Task",
    color="Task",
    color_discrete_sequence=px.colors.qualitative.Light24,
)
fig.write_html("gantt-light24.html")
儲存的頁面會呈現以下圖表:
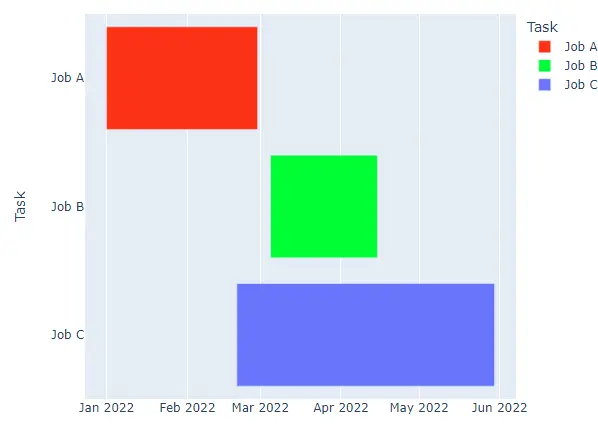
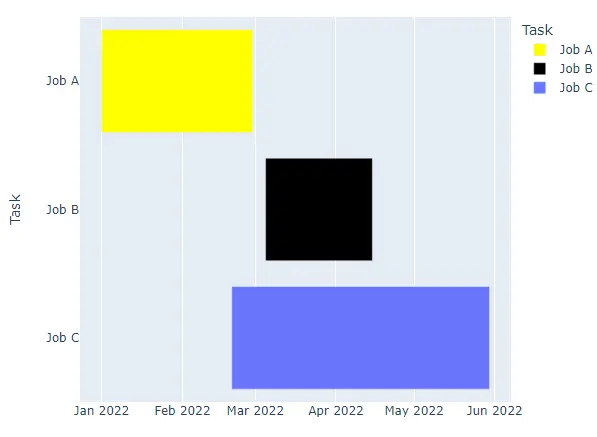
若要將特定顏色固定指派給具名任務,請將字典傳給 color_discrete_map;未列入字典的任務會繼續使用目前色彩序列中的顏色。
import plotly.express as px

df = [
    dict(Task="Job A", Start="2022-01-01", Finish="2022-02-28"),
    dict(Task="Job B", Start="2022-03-05", Finish="2022-04-15"),
    dict(Task="Job C", Start="2022-02-20", Finish="2022-05-30"),
]

fig = px.timeline(
    df,
    x_start="Start",
    x_end="Finish",
    y="Task",
    color="Task",
    color_discrete_map={"Job A": "yellow", "Job B": "black"},
)
fig.write_html("gantt-color-map.html")
儲存的頁面會呈現以下圖表:
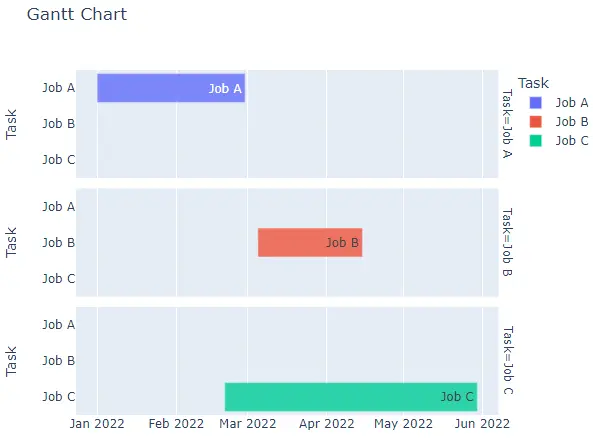
title 引數設定圖表標題,width 和 height 則以像素設定圖表大小。hover_name 選擇游標停留在長條上時顯示的標籤,text 會在每個長條內印出標籤,而 opacity 接受 0 到 1 的數值。facet_row 或 facet_col 會依每個值將圖表分割成對應的子圖,facet_row_spacing 和 facet_col_spacing 則以 0 到 1 的比例控制子圖之間的間距。
import plotly.express as px

df = [
    dict(Task="Job A", Start="2022-01-01", Finish="2022-02-28"),
    dict(Task="Job B", Start="2022-03-05", Finish="2022-04-15"),
    dict(Task="Job C", Start="2022-02-20", Finish="2022-05-30"),
]

fig = px.timeline(
    df,
    x_start="Start",
    x_end="Finish",
    y="Task",
    color="Task",
    title="Gantt Chart",
    hover_name="Task",
    text="Task",
    opacity=0.8,
    facet_row="Task",
)
fig.write_html("gantt-facets.html")
儲存的頁面會呈現以下圖表:
使用 plotly.figure_factory.create_gantt() 建立並自訂甘特圖
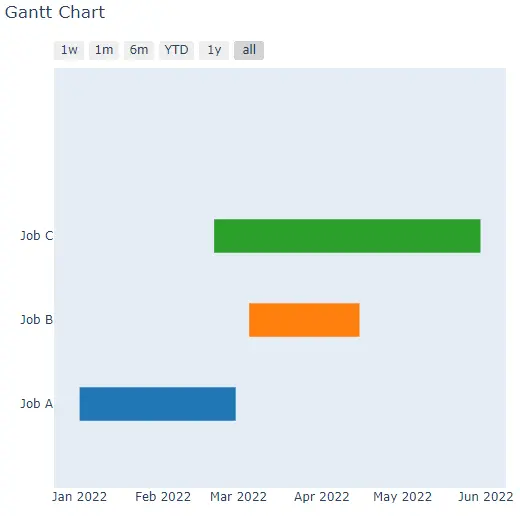
create_gantt() 函式會使用相同的三個欄位建立同類型圖表。它接受字典串列(如下方範例所用的形式),或具有 Task、Start 和 Finish 欄位的 pandas DataFrame。Plotly 已將 create_gantt() 標記為棄用,改用 timeline();Plotly 7 則完全移除了此函式,因此該呼叫僅適用於 Plotly 6 或更早版本。以下每個指令碼都會先檢查 hasattr();在沒有此函式的版本中,它會印出提示訊息,而不是繪製圖表。
本節中的程式碼以及顯示的標籤或輸出仍為英文。
import plotly.figure_factory as pff

df = [
    dict(Task="Job A", Start="2022-01-01", Finish="2022-02-28"),
    dict(Task="Job B", Start="2022-03-05", Finish="2022-04-15"),
    dict(Task="Job C", Start="2022-02-20", Finish="2022-05-30"),
]

if hasattr(pff, "create_gantt"):
    fig = pff.create_gantt(df)
    fig.show()
else:
    print("create_gantt() is not available in this Plotly release")
在 Plotly 7 中,指令碼會印出:
create_gantt() is not available in this Plotly release
在 Plotly 6 或更早版本中,它會呈現以下圖表:
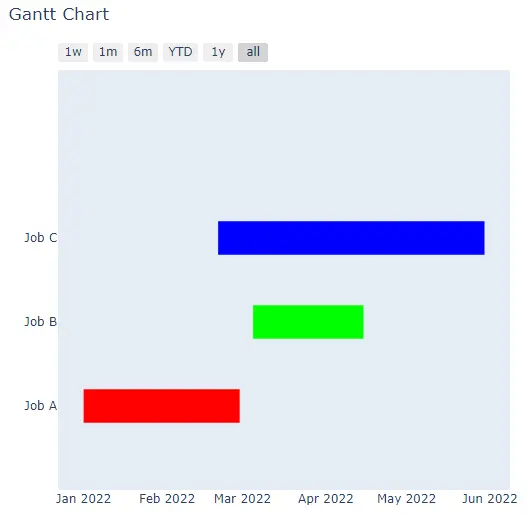
將決定長條顏色的欄位指定給 index_col,然後透過 colors 字典,為每個索引值指派 rgb() 或十六進位顏色。
import plotly.figure_factory as pff

df = [
    dict(Task="Job A", Start="2022-01-01", Finish="2022-02-28"),
    dict(Task="Job B", Start="2022-03-05", Finish="2022-04-15"),
    dict(Task="Job C", Start="2022-02-20", Finish="2022-05-30"),
]

if hasattr(pff, "create_gantt"):
    fig = pff.create_gantt(
        df,
        index_col="Task",
        colors={"Job A": "rgb(255,0,0)", "Job B": "rgb(0,255,0)", "Job C": "rgb(0,0,255)"},
    )
    fig.show()
else:
    print("create_gantt() is not available in this Plotly release")
在 Plotly 7 中,指令碼會印出:
create_gantt() is not available in this Plotly release
在 Plotly 6 或更早版本中,它會呈現以下圖表:
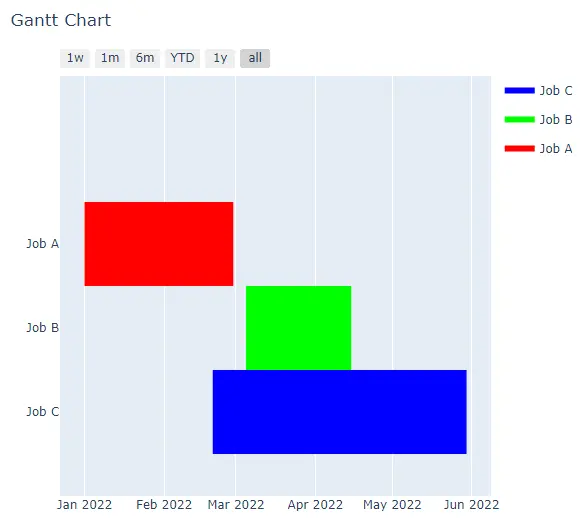
其餘選項與 plotly.express 的引數對應:title、width 和 height 設定標題與圖表大小,bar_width 設定長條粗細,showgrid_x 和 showgrid_y 則切換座標軸格線。show_hover_fill 可啟用或停用長條填滿區域上的懸停文字;group_tasks 設為 True 時,會將具有相同 index_col 值的任務繪製在同一列。show_colorbar 會顯示色階,但僅限索引欄位包含數值時;若使用 Task 這類文字索引,則會改為產生圖例。
import plotly.figure_factory as pff

df = [
    dict(Task="Job A", Start="2022-01-01", Finish="2022-02-28"),
    dict(Task="Job B", Start="2022-03-05", Finish="2022-04-15"),
    dict(Task="Job C", Start="2022-02-20", Finish="2022-05-30"),
]

if hasattr(pff, "create_gantt"):
    fig = pff.create_gantt(
        df,
        index_col="Task",
        colors={"Job A": "rgb(255,0,0)", "Job B": "rgb(0,255,0)", "Job C": "rgb(0,0,255)"},
        show_colorbar=True,
        group_tasks=True,
        showgrid_x=True,
        bar_width=0.5,
    )
    fig.show()
else:
    print("create_gantt() is not available in this Plotly release")
在 Plotly 7 中,指令碼會印出:
create_gantt() is not available in this Plotly release
在 Plotly 6 或更早版本中,它會呈現以下圖表:
選擇 API 並驗證圖表
對於新程式碼,建議優先使用 timeline():它屬於 plotly.express,可在目前的 Plotly 版本上執行,並涵蓋相同的任務資料。維護為 Plotly 6 或更早版本撰寫的程式碼時,仍需了解 create_gantt();如上方圖片所示,其圖表也會在繪圖區上方新增一列日期範圍選取器。
timeline() 圖表會為 color 欄中的每個值保留一個 trace,因此印出 trace 名稱即可確認哪些任務已加入圖表。執行此範例:
本節中的程式碼以及顯示的標籤或輸出仍為英文。
import plotly.express as px

df = [
    dict(Task="Job A", Start="2022-01-01", Finish="2022-02-28"),
    dict(Task="Job B", Start="2022-03-05", Finish="2022-04-15"),
    dict(Task="Job C", Start="2022-02-20", Finish="2022-05-30"),
]

fig = px.timeline(df, x_start="Start", x_end="Finish", y="Task", color="Task")
print([trace.name for trace in fig.data])
['Job A', 'Job B', 'Job C']
每個印出的名稱都對應資料中的一項任務,因此圖表包含每項工作一個長條。