HOWTO · Plotly
Plotly 甘特图
本文教你在 Python 中使用 Plotly 的 timeline()和 create_gantt()函数创建甘特图。
本页内容
甘特图以水平条形展示项目进度:每个条形覆盖一项任务的开始和结束日期。本教程使用 plotly.express 的 timeline() 函数和 plotly.figure_factory 的 create_gantt() 函数在 Python 中用 Plotly 创建甘特图,然后调整图表的颜色、标签和布局。
使用 plotly.express.timeline() 创建甘特图
timeline() 函数根据提供三个字段的记录构建甘特图:Task 是作为字符串的任务名称;Start 是开始日期;Finish 是结束日期。将这些字段名分别传给 x_start、x_end 和 y 参数。Plotly 会自行解析年-月-日格式的日期字符串。
下面的示例用字典列表定义了三个任务,并通过将 color 映射到 Task 为每个条形指定不同的颜色。fig.write_html() 将图表保存为可在任何浏览器中打开的独立页面;在 notebook 或交互式会话中,改用 fig.show() 即可内联渲染图表。
本节中的代码以及显示的标签或输出仍为英文。
import plotly.express as px

df = [
    dict(Task="Job A", Start="2022-01-01", Finish="2022-02-28"),
    dict(Task="Job B", Start="2022-03-05", Finish="2022-04-15"),
    dict(Task="Job C", Start="2022-02-20", Finish="2022-05-30"),
]

fig = px.timeline(df, x_start="Start", x_end="Finish", y="Task", color="Task")
fig.write_html("gantt-timeline.html")
保存的页面会渲染出以下图表:
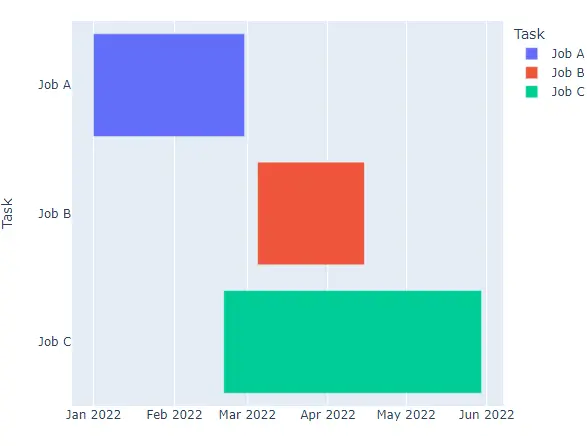
自定义 plotly.express 甘特图
使用 color_discrete_sequence 参数将默认调色板替换为诸如 Light24 或 Dark24 的定性色序列。
本节中的代码以及显示的标签或输出仍为英文。
import plotly.express as px

df = [
    dict(Task="Job A", Start="2022-01-01", Finish="2022-02-28"),
    dict(Task="Job B", Start="2022-03-05", Finish="2022-04-15"),
    dict(Task="Job C", Start="2022-02-20", Finish="2022-05-30"),
]

fig = px.timeline(
    df,
    x_start="Start",
    x_end="Finish",
    y="Task",
    color="Task",
    color_discrete_sequence=px.colors.qualitative.Light24,
)
fig.write_html("gantt-light24.html")
保存的页面会渲染出以下图表:
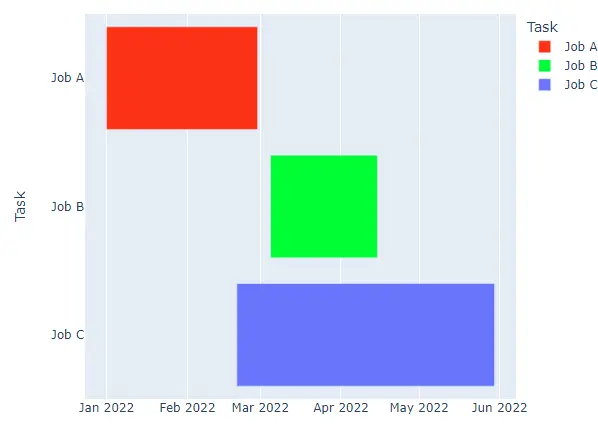
要为指定任务固定确切的颜色,请向 color_discrete_map 传递一个字典;字典中未列出的任务会继续使用当前序列中的颜色。
import plotly.express as px

df = [
    dict(Task="Job A", Start="2022-01-01", Finish="2022-02-28"),
    dict(Task="Job B", Start="2022-03-05", Finish="2022-04-15"),
    dict(Task="Job C", Start="2022-02-20", Finish="2022-05-30"),
]

fig = px.timeline(
    df,
    x_start="Start",
    x_end="Finish",
    y="Task",
    color="Task",
    color_discrete_map={"Job A": "yellow", "Job B": "black"},
)
fig.write_html("gantt-color-map.html")
保存的页面会渲染出以下图表:
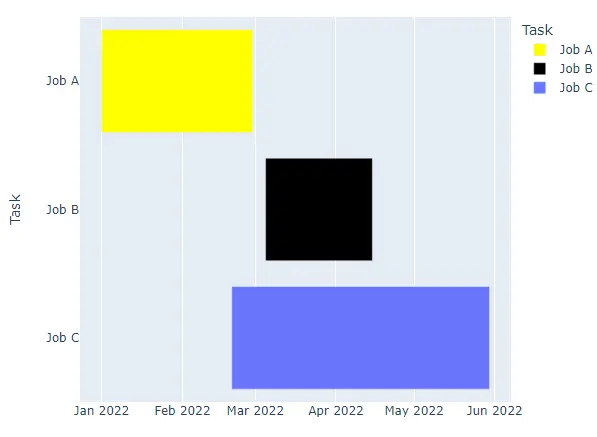
title 参数设置图表标题,width 和 height 以像素为单位设置图形尺寸。hover_name 选择悬停在条形上时显示的标签,text 在每个条形内打印标签,opacity 接受 0 到 1 之间的值。facet_row 或 facet_col 将图表按每个值拆分为一个子图,facet_row_spacing 和 facet_col_spacing 以 0 到 1 之间的小数控制子图之间的间距。
import plotly.express as px

df = [
    dict(Task="Job A", Start="2022-01-01", Finish="2022-02-28"),
    dict(Task="Job B", Start="2022-03-05", Finish="2022-04-15"),
    dict(Task="Job C", Start="2022-02-20", Finish="2022-05-30"),
]

fig = px.timeline(
    df,
    x_start="Start",
    x_end="Finish",
    y="Task",
    color="Task",
    title="Gantt Chart",
    hover_name="Task",
    text="Task",
    opacity=0.8,
    facet_row="Task",
)
fig.write_html("gantt-facets.html")
保存的页面会渲染出以下图表:
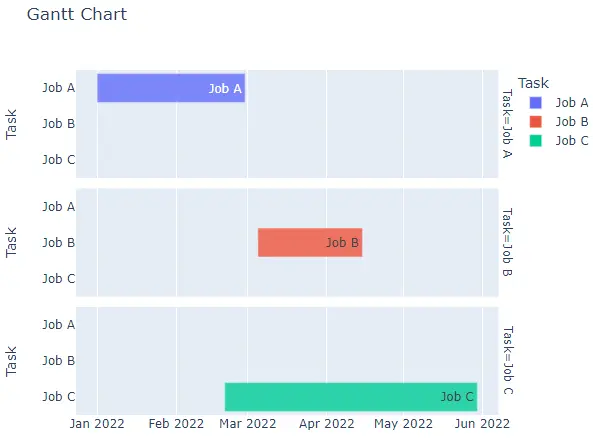
使用 plotly.figure_factory.create_gantt() 创建并自定义甘特图
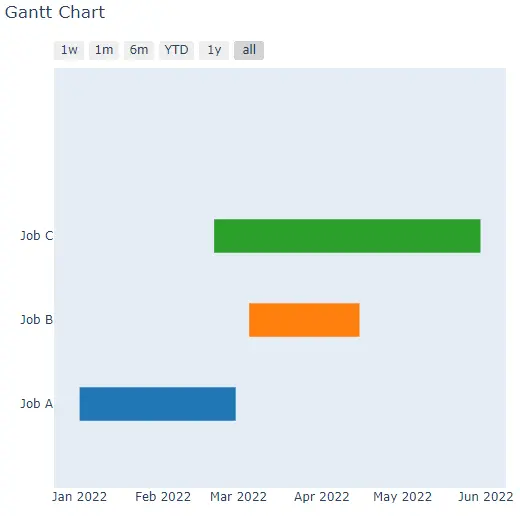
create_gantt() 函数用同样的三个字段构建同类的图表。它接受字典列表(即下面使用的形式),或带有 Task、Start 和 Finish 列的 pandas DataFrame。Plotly 已将 create_gantt() 标记为弃用,推荐使用 timeline(),并且 Plotly 7 已完全移除该函数,因此该调用仅在 Plotly 6 或更早版本上有效。下面的每个脚本都先用 hasattr() 检查;在没有该函数的版本上,它会打印一条提示而不是绘制图表。
本节中的代码以及显示的标签或输出仍为英文。
import plotly.figure_factory as pff

df = [
    dict(Task="Job A", Start="2022-01-01", Finish="2022-02-28"),
    dict(Task="Job B", Start="2022-03-05", Finish="2022-04-15"),
    dict(Task="Job C", Start="2022-02-20", Finish="2022-05-30"),
]

if hasattr(pff, "create_gantt"):
    fig = pff.create_gantt(df)
    fig.show()
else:
    print("create_gantt() is not available in this Plotly release")
在 Plotly 7 上,脚本会打印:
create_gantt() is not available in this Plotly release
在 Plotly 6 或更早版本上,它会渲染出以下图表:
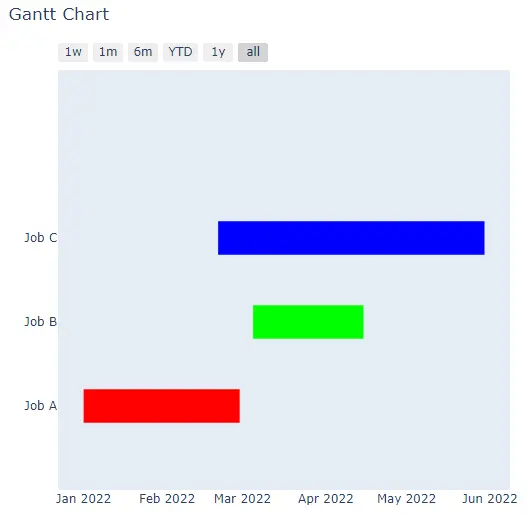
将其值驱动条形颜色的字段传给 index_col,然后通过 colors 字典为每个索引值分配一个 rgb() 或十六进制颜色。
import plotly.figure_factory as pff

df = [
    dict(Task="Job A", Start="2022-01-01", Finish="2022-02-28"),
    dict(Task="Job B", Start="2022-03-05", Finish="2022-04-15"),
    dict(Task="Job C", Start="2022-02-20", Finish="2022-05-30"),
]

if hasattr(pff, "create_gantt"):
    fig = pff.create_gantt(
        df,
        index_col="Task",
        colors={"Job A": "rgb(255,0,0)", "Job B": "rgb(0,255,0)", "Job C": "rgb(0,0,255)"},
    )
    fig.show()
else:
    print("create_gantt() is not available in this Plotly release")
在 Plotly 7 上,脚本会打印:
create_gantt() is not available in this Plotly release
在 Plotly 6 或更早版本上,它会渲染出以下图表:
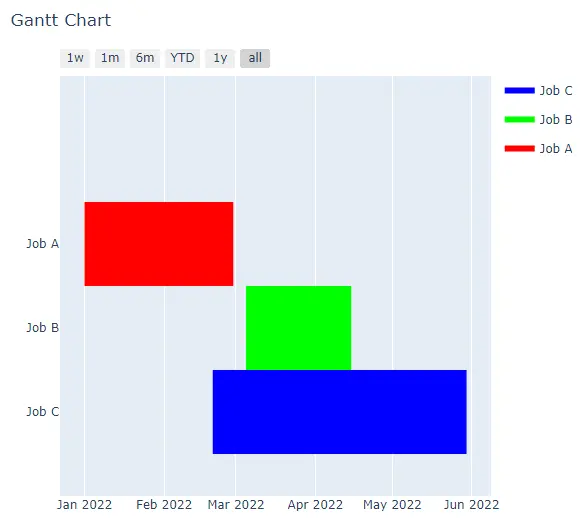
其余选项与 plotly.express 的参数相对应:title、width 和 height 设置标题和图形尺寸,bar_width 设置条形粗细,showgrid_x 和 showgrid_y 控制坐标轴网格的开关。show_hover_fill 启用或禁用条形填充区域上的悬停文本,group_tasks 设为 True 时会把共享同一 index_col 值的任务绘制在同一行。show_colorbar 显示颜色标尺,但仅当索引列包含数值时才有效;像 Task 这样的文本索引会生成图例。
import plotly.figure_factory as pff

df = [
    dict(Task="Job A", Start="2022-01-01", Finish="2022-02-28"),
    dict(Task="Job B", Start="2022-03-05", Finish="2022-04-15"),
    dict(Task="Job C", Start="2022-02-20", Finish="2022-05-30"),
]

if hasattr(pff, "create_gantt"):
    fig = pff.create_gantt(
        df,
        index_col="Task",
        colors={"Job A": "rgb(255,0,0)", "Job B": "rgb(0,255,0)", "Job C": "rgb(0,0,255)"},
        show_colorbar=True,
        group_tasks=True,
        showgrid_x=True,
        bar_width=0.5,
    )
    fig.show()
else:
    print("create_gantt() is not available in this Plotly release")
在 Plotly 7 上,脚本会打印:
create_gantt() is not available in this Plotly release
在 Plotly 6 或更早版本上,它会渲染出以下图表:
选择 API 并验证图表
对于新代码,优先使用 timeline():它属于 plotly.express,可在当前 Plotly 版本上运行,并覆盖相同的任务数据。维护为 Plotly 6 或更早版本编写的代码时,请记住 create_gantt();如上面的图片所示,它的图形还会在绘图区上方添加一排日期范围选择器。
timeline() 图形为 color 列中的每个值保留一条轨迹(trace),因此打印轨迹名称即可确认哪些任务进入了图表。运行以下示例:
本节中的代码以及显示的标签或输出仍为英文。
import plotly.express as px

df = [
    dict(Task="Job A", Start="2022-01-01", Finish="2022-02-28"),
    dict(Task="Job B", Start="2022-03-05", Finish="2022-04-15"),
    dict(Task="Job C", Start="2022-02-20", Finish="2022-05-30"),
]

fig = px.timeline(df, x_start="Start", x_end="Finish", y="Task", color="Task")
print([trace.name for trace in fig.data])
['Job A', 'Job B', 'Job C']
每个打印出的名称都与数据中的一个任务对应,因此图表中每个作业各占一个条形。