How to Visualize Confusion Matrix Using Caret Package in R
-
Use the
confusionMatrixFunction to Create a Confusion Matrix in R -
Use the
fourfoldplotFunction to Visualize Confusion Matrix in R -
Use the
autoplotFunction to Visualize Confusion Matrix in R
This article will demonstrate multiple methods of visualizing a confusion matrix using the caret package in R.
Use the confusionMatrix Function to Create a Confusion Matrix in R
The confusionMatrix function is part of the caret package and can create a confusion matrix from the factors or table data types. Note that we construct two random factors using sample and rep functions. confusionMatrix takes the factor of predicted classes as the first argument and the factor of classes to be used as true results as the second one.
library(caret)

confusionMatrix(
  factor(sample(rep(letters[1:4], 200), 50)),
  factor(sample(rep(letters[1:4], 200), 50)))
Confusion Matrix and Statistics

          Reference
Prediction a b c d
         a 2 5 6 2
         b 3 2 4 2
         c 3 5 2 2
         d 5 1 2 4

Overall Statistics

               Accuracy : 0.2
                 95% CI : (0.1003, 0.3372)
    No Information Rate : 0.28
    P-Value [Acc > NIR] : 0.9260

                  Kappa : -0.0672

 Mcnemar's Test P-Value : 0.7795

Statistics by Class:

                     Class: a Class: b Class: c Class: d
Sensitivity            0.1538   0.1538   0.1429   0.4000
Specificity            0.6486   0.7568   0.7222   0.8000
Pos Pred Value         0.1333   0.1818   0.1667   0.3333
Neg Pred Value         0.6857   0.7179   0.6842   0.8421
Prevalence             0.2600   0.2600   0.2800   0.2000
Detection Rate         0.0400   0.0400   0.0400   0.0800
Detection Prevalence   0.3000   0.2200   0.2400   0.2400
Balanced Accuracy      0.4012   0.4553   0.4325   0.6000
Use the fourfoldplot Function to Visualize Confusion Matrix in R
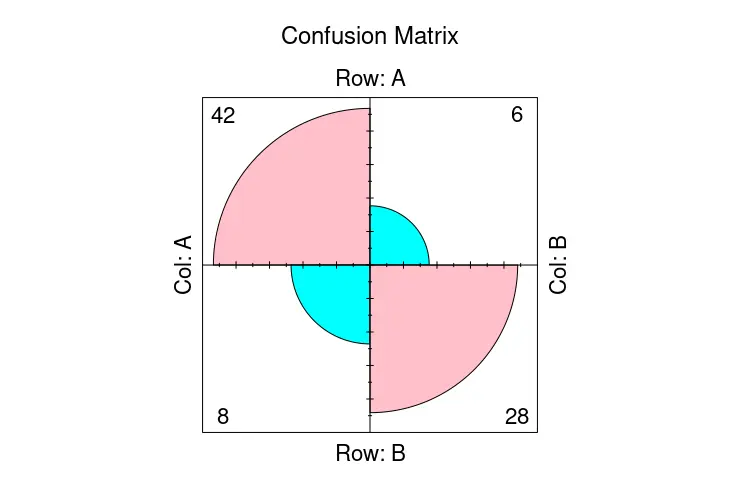
The confusionMatrix function outputs the textual data, but we can visualize the part of them with the help of the fourfoldplot function. fourfoldplot constructs a fourfold graph with two by two by k contingency table. The contingency table should be passed in an array form or as a 2x2 matrix if k is equal to 1. Note that the following example demonstrates the usage of fourfoldplot with the hard-coded table data.
ctable <- as.table(matrix(c(42, 6, 8, 28), nrow = 2, byrow = TRUE))
fourfoldplot(ctable, color = c("cyan", "pink"),
             conf.level = 0, margin = 1, main = "Confusion Matrix")
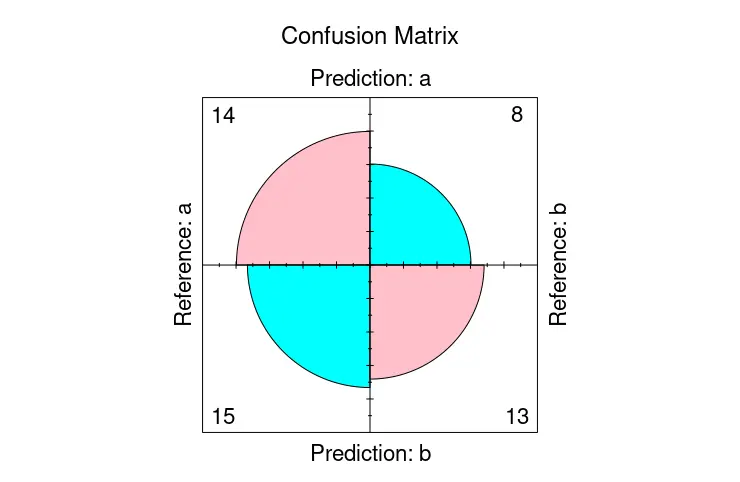
On the other hand, we can store confusionMatrix as an object and pass the table member from it to the fourfoldplot to visualize the confusion matrix.
library(caret)

cmat <- confusionMatrix(
  factor(sample(rep(letters[1:2], 200), 50)),
  factor(sample(rep(letters[1:2], 200), 50)))

fourfoldplot(cmat$table, color = c("cyan", "pink"),
             conf.level = 0, margin = 1, main = "Confusion Matrix")
Use the autoplot Function to Visualize Confusion Matrix in R
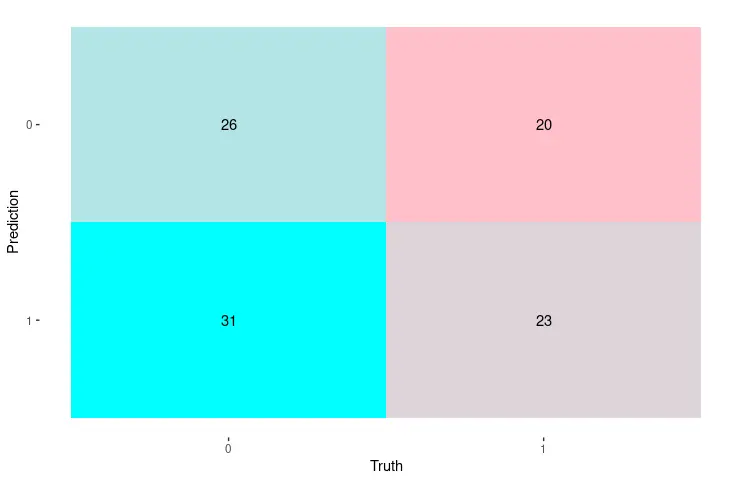
Alternatively, we can utilize the autoplot function from the ggplot2 package to display the confusion matrix. In this case, we construct the matrix with the conf_mat function that produces an object of the conf_mat class that can be directly passed as the first argument to the autoplot function. The latter automatically determines to draw a corresponding graph for the object.
library(yardstick)
library(ggplot2)

set.seed(123)
truth_predicted <- data.frame(
  obs = sample(0:1,100, replace = T),
  pred = sample(0:1,100, replace = T)
)
truth_predicted$obs <- as.factor(truth_predicted$obs)
truth_predicted$pred <- as.factor(truth_predicted$pred)

cm <- conf_mat(truth_predicted, obs, pred)

autoplot(cm, type = "heatmap") +
  scale_fill_gradient(low = "pink", high = "cyan")

Founder of DelftStack.com. Jinku has worked in the robotics and automotive industries for over 8 years. He sharpened his coding skills when he needed to do the automatic testing, data collection from remote servers and report creation from the endurance test. He is from an electrical/electronics engineering background but has expanded his interest to embedded electronics, embedded programming and front-/back-end programming.
LinkedIn Facebook