R에서 캐럿 패키지를 사용하여 혼동 행렬 시각화
-
confusionMatrix함수를 사용하여 R에서 혼동 행렬 만들기 -
fourfoldplot함수를 사용하여 R에서 혼동 행렬 시각화 -
autoplot함수를 사용하여 R에서 혼동 행렬 시각화

이 기사에서는 R에서caret패키지를 사용하여 혼동 행렬을 시각화하는 여러 방법을 보여줍니다.
confusionMatrix함수를 사용하여 R에서 혼동 행렬 만들기
confusionMatrix함수는caret패키지의 일부이며 요인 또는 테이블 데이터 유형에서 혼동 행렬을 만들 수 있습니다. sample및rep함수를 사용하여 두 개의 랜덤 요인을 구성합니다. confusionMatrix는 예측 된 클래스의 인수를 첫 번째 인수로 사용하고 클래스의 인수를 두 번째 인수로 실제 결과로 사용합니다.
library(caret)

confusionMatrix(
  factor(sample(rep(letters[1:4], 200), 50)),
  factor(sample(rep(letters[1:4], 200), 50)))
Confusion Matrix and Statistics

          Reference
Prediction a b c d
         a 2 5 6 2
         b 3 2 4 2
         c 3 5 2 2
         d 5 1 2 4

Overall Statistics

               Accuracy : 0.2
                 95% CI : (0.1003, 0.3372)
    No Information Rate : 0.28
    P-Value [Acc > NIR] : 0.9260

                  Kappa : -0.0672

 Mcnemar's Test P-Value : 0.7795

Statistics by Class:

                     Class: a Class: b Class: c Class: d
Sensitivity            0.1538   0.1538   0.1429   0.4000
Specificity            0.6486   0.7568   0.7222   0.8000
Pos Pred Value         0.1333   0.1818   0.1667   0.3333
Neg Pred Value         0.6857   0.7179   0.6842   0.8421
Prevalence             0.2600   0.2600   0.2800   0.2000
Detection Rate         0.0400   0.0400   0.0400   0.0800
Detection Prevalence   0.3000   0.2200   0.2400   0.2400
Balanced Accuracy      0.4012   0.4553   0.4325   0.6000
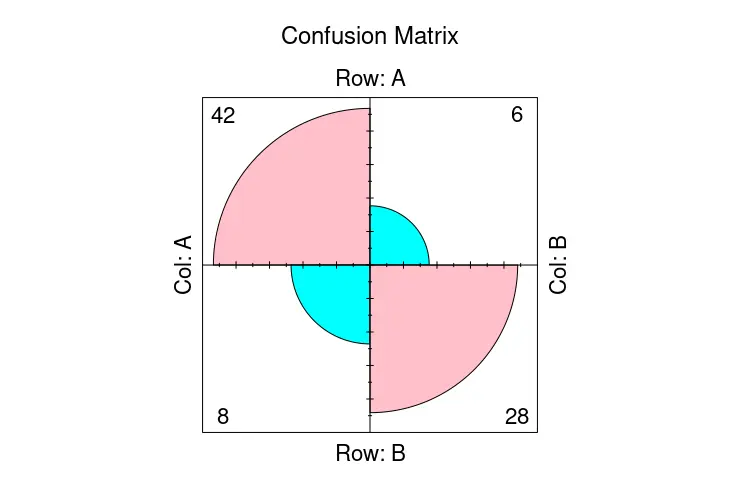
fourfoldplot함수를 사용하여 R에서 혼동 행렬 시각화
confusionMatrix함수는 텍스트 데이터를 출력하지만fourfoldplot함수를 사용하여 그 일부를 시각화 할 수 있습니다. fourfoldplot은k분할 표에 의해 2x2로 4 중 그래프를 구성합니다. 분할 표는k가1과 같은 경우 배열 형식 또는 2x2 행렬로 전달되어야합니다. 다음 예제는 하드 코딩 된 테이블 데이터와 함께fourfoldplot의 사용법을 보여줍니다.
ctable <- as.table(matrix(c(42, 6, 8, 28), nrow = 2, byrow = TRUE))
fourfoldplot(ctable, color = c("cyan", "pink"),
             conf.level = 0, margin = 1, main = "Confusion Matrix")
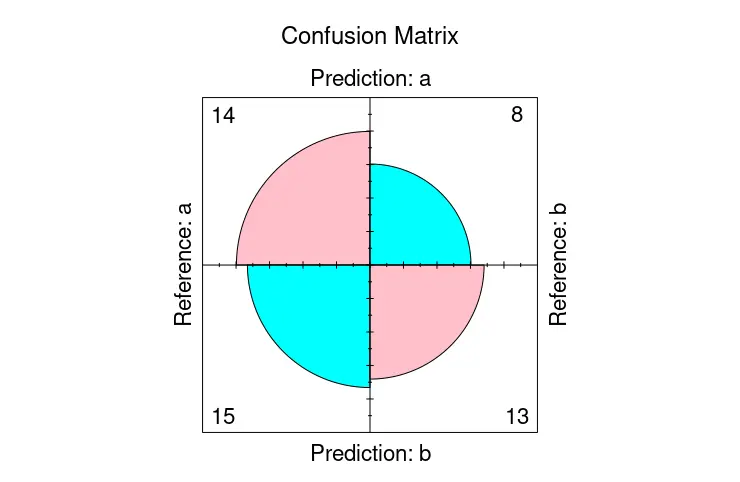
반면에confusionMatrix를 객체로 저장하고table멤버를fourfoldplot으로 전달하여 혼동 행렬을 시각화 할 수 있습니다.
library(caret)

cmat <- confusionMatrix(
  factor(sample(rep(letters[1:2], 200), 50)),
  factor(sample(rep(letters[1:2], 200), 50)))

fourfoldplot(cmat$table, color = c("cyan", "pink"),
             conf.level = 0, margin = 1, main = "Confusion Matrix")
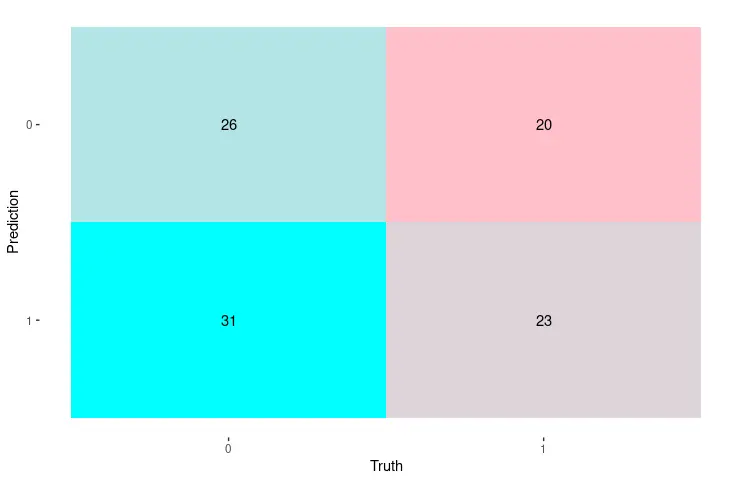
autoplot함수를 사용하여 R에서 혼동 행렬 시각화
또는ggplot2패키지의autoplot기능을 사용하여 혼동 행렬을 표시 할 수 있습니다. 이 경우autoplot함수에 대한 첫 번째 인수로 직접 전달할 수있는conf_mat클래스의 객체를 생성하는conf_mat함수로 행렬을 구성합니다. 후자는 자동으로 개체에 해당하는 그래프를 그릴 지 결정합니다.
library(yardstick)
library(ggplot2)

set.seed(123)
truth_predicted <- data.frame(
  obs = sample(0:1,100, replace = T),
  pred = sample(0:1,100, replace = T)
)
truth_predicted$obs <- as.factor(truth_predicted$obs)
truth_predicted$pred <- as.factor(truth_predicted$pred)

cm <- conf_mat(truth_predicted, obs, pred)

autoplot(cm, type = "heatmap") +
  scale_fill_gradient(low = "pink", high = "cyan")

Founder of DelftStack.com. Jinku has worked in the robotics and automotive industries for over 8 years. He sharpened his coding skills when he needed to do the automatic testing, data collection from remote servers and report creation from the endurance test. He is from an electrical/electronics engineering background but has expanded his interest to embedded electronics, embedded programming and front-/back-end programming.
LinkedIn Facebook