在 R 中使用 Caret 包可视化混淆矩阵

本文将演示使用 R 中的 caret 包可视化混淆矩阵的多种方法。
在 R 中使用 confusionMatrix 函数创建混淆矩阵
confusionMatrix 函数是 caret 包的一部分,可以从因子或表数据类型创建混淆矩阵。请注意,我们使用 sample 和 rep 函数构造了两个随机因子。confusionMatrix 将预测类别的因子作为第一个参数,将用作真实结果的类别因子作为第二个参数。
library(caret)

confusionMatrix(
  factor(sample(rep(letters[1:4], 200), 50)),
  factor(sample(rep(letters[1:4], 200), 50)))
Confusion Matrix and Statistics

          Reference
Prediction a b c d
         a 2 5 6 2
         b 3 2 4 2
         c 3 5 2 2
         d 5 1 2 4

Overall Statistics

               Accuracy : 0.2
                 95% CI : (0.1003, 0.3372)
    No Information Rate : 0.28
    P-Value [Acc > NIR] : 0.9260

                  Kappa : -0.0672

 Mcnemar's Test P-Value : 0.7795

Statistics by Class:

                     Class: a Class: b Class: c Class: d
Sensitivity            0.1538   0.1538   0.1429   0.4000
Specificity            0.6486   0.7568   0.7222   0.8000
Pos Pred Value         0.1333   0.1818   0.1667   0.3333
Neg Pred Value         0.6857   0.7179   0.6842   0.8421
Prevalence             0.2600   0.2600   0.2800   0.2000
Detection Rate         0.0400   0.0400   0.0400   0.0800
Detection Prevalence   0.3000   0.2200   0.2400   0.2400
Balanced Accuracy      0.4012   0.4553   0.4325   0.6000
在 R 中使用 fourfoldplot 函数可视化混淆矩阵
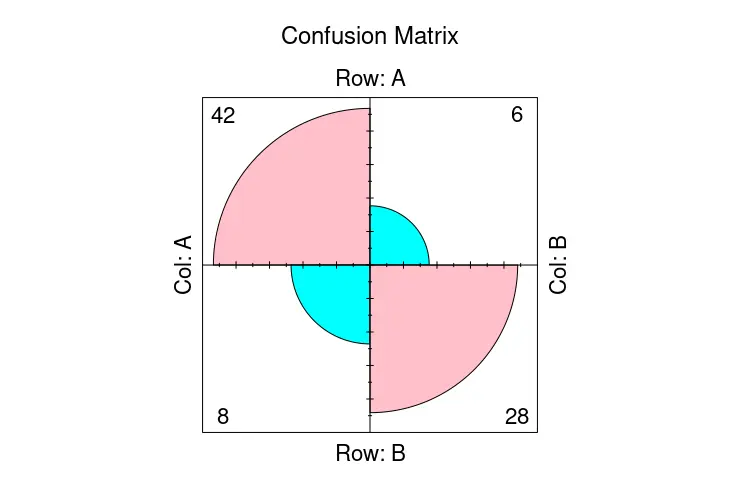
confusionMatrix 函数输出文本数据,但我们可以在 fourfoldplot 函数的帮助下将其中的一部分可视化。fourfoldplot 用 k 列联表构造一个二乘二的四重图。如果 k 等于 1,列联表应以数组形式或作为 2x2 矩阵传递。请注意,以下示例演示了 fourfoldplot 与硬编码表数据的用法。
ctable <- as.table(matrix(c(42, 6, 8, 28), nrow = 2, byrow = TRUE))
fourfoldplot(ctable, color = c("cyan", "pink"),
             conf.level = 0, margin = 1, main = "Confusion Matrix")
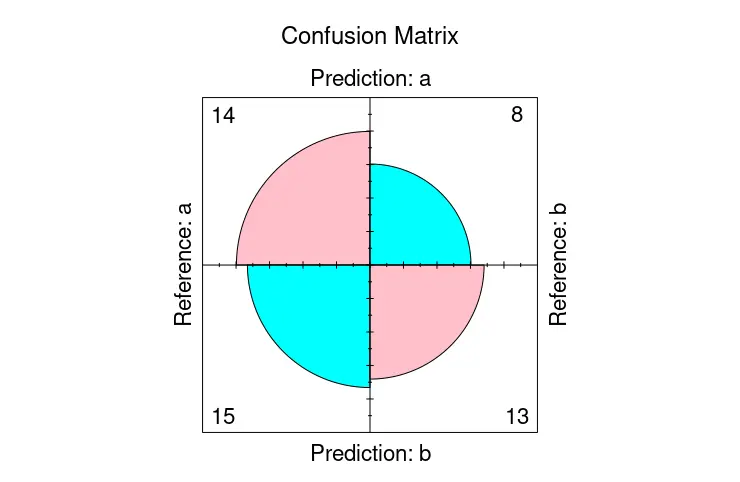
另一方面,我们可以将 confusionMatrix 存储为一个对象,并将其中的 table 成员传递给 fourfoldplot 以可视化混淆矩阵。
library(caret)

cmat <- confusionMatrix(
  factor(sample(rep(letters[1:2], 200), 50)),
  factor(sample(rep(letters[1:2], 200), 50)))

fourfoldplot(cmat$table, color = c("cyan", "pink"),
             conf.level = 0, margin = 1, main = "Confusion Matrix")
在 R 中使用 autoplot 函数可视化混淆矩阵
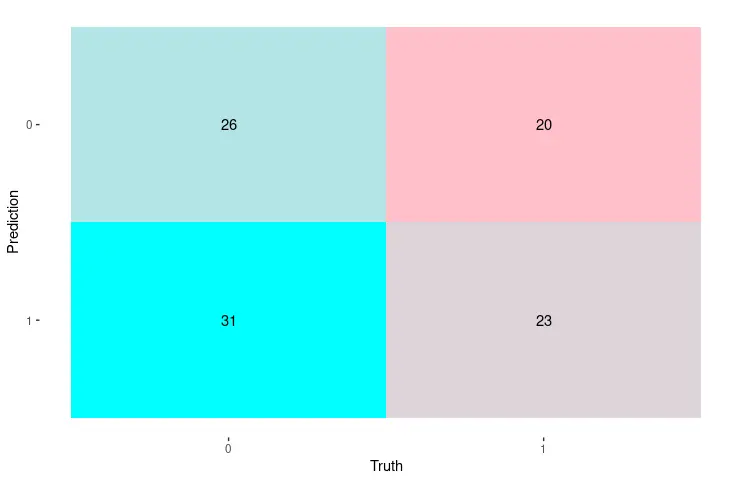
或者,我们可以利用 ggplot2 包中的 autoplot 函数来显示混淆矩阵。在这种情况下,我们使用 conf_mat 函数构造矩阵,该函数生成 conf_mat 类的对象,该对象可以作为第一个参数直接传递给 autoplot 函数。后者自动确定为对象绘制相应的图形。
library(yardstick)
library(ggplot2)

set.seed(123)
truth_predicted <- data.frame(
  obs = sample(0:1,100, replace = T),
  pred = sample(0:1,100, replace = T)
)
truth_predicted$obs <- as.factor(truth_predicted$obs)
truth_predicted$pred <- as.factor(truth_predicted$pred)

cm <- conf_mat(truth_predicted, obs, pred)

autoplot(cm, type = "heatmap") +
  scale_fill_gradient(low = "pink", high = "cyan")
Enjoying our tutorials? Subscribe to DelftStack on YouTube to support us in creating more high-quality video guides. Subscribe
作者: Jinku Hu
