Matplotlib 에서 x, y 좌표 목록을 그리는 방법
Jinku Hu
2020년6월25일
Matplotlib
Matplotlib Scatter Plot
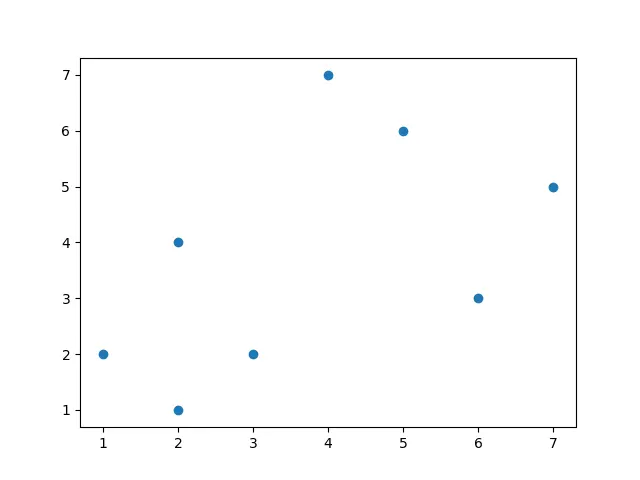
(x, y)와 같은 2 개의 튜플 목록이 있고 그것들이(x, y)좌표 인 것처럼 그것들을 그려야한다고 가정 해 봅시다.
data = [
    [1, 2],
    [3, 2],
    [4, 7],
    [2, 4],
    [2, 1],
    [5, 6],
    [6, 3],
    [7, 5],
]
Matplotlib 에서(x, y)좌표 목록을 작성하기위한 전체 코드,
import matplotlib.pyplot as plt

data = [
    [1, 2],
    [3, 2],
    [4, 7],
    [2, 4],
    [2, 1],
    [5, 6],
    [6, 3],
    [7, 5],
]

x, y = zip(*data)
plt.scatter(x, y)
plt.show()
x, y = zip(*data)
zip function을 사용하여 쌍에서 목록으로 데이터를 압축 해제합니다.
plt.scatter(x, y)
산점도를 생성해야하므로 ‘산란’은이 응용 프로그램에 사용되는 올바른 그림 유형입니다.
튜토리얼이 마음에 드시나요? DelftStack을 구독하세요 YouTube에서 저희가 더 많은 고품질 비디오 가이드를 제작할 수 있도록 지원해주세요. 구독하다
작가: Jinku Hu

Founder of DelftStack.com. Jinku has worked in the robotics and automotive industries for over 8 years. He sharpened his coding skills when he needed to do the automatic testing, data collection from remote servers and report creation from the endurance test. He is from an electrical/electronics engineering background but has expanded his interest to embedded electronics, embedded programming and front-/back-end programming.
LinkedIn Facebook