Cómo trazar la lista de coordenadas x,y en Matplotlib
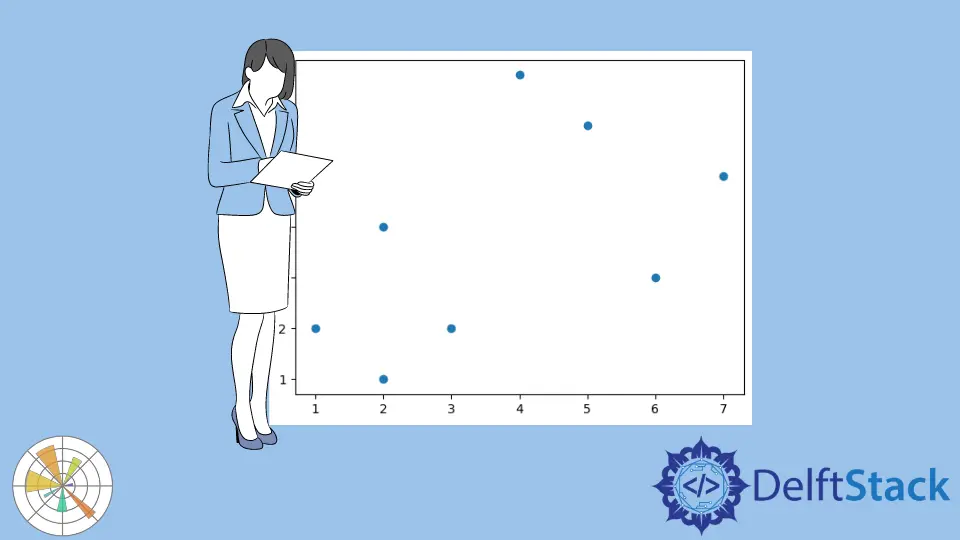
Supongamos que tenemos una lista de 2-tuplas como (x, y), y necesitamos graficarlas como son las coordenadas (x, y).
data = [
    [1, 2],
    [3, 2],
    [4, 7],
    [2, 4],
    [2, 1],
    [5, 6],
    [6, 3],
    [7, 5],
]
Códigos completos para trazar esta lista de coordenadas (x, y) en Matplotlib,
import matplotlib.pyplot as plt

data = [
    [1, 2],
    [3, 2],
    [4, 7],
    [2, 4],
    [2, 1],
    [5, 6],
    [6, 3],
    [7, 5],
]

x, y = zip(*data)
plt.scatter(x, y)
plt.show()
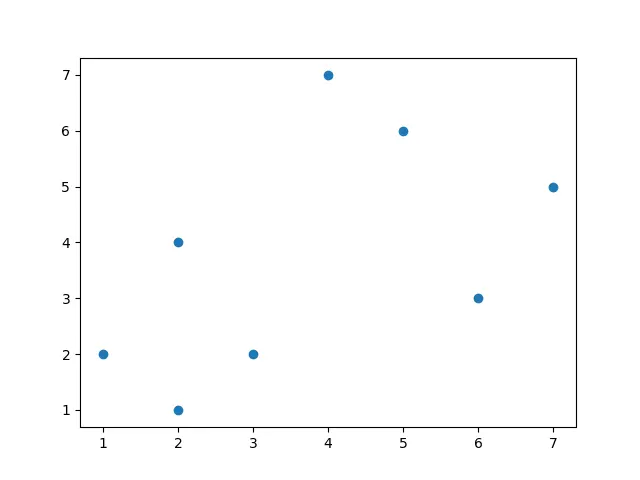
x, y = zip(*data)
Desempaqueta los datos de los pares a las listas usando la función zip.
plt.scatter(x, y)
Necesitamos crear la gráfica de dispersión, por lo tanto scatter es el tipo de gráfica correcta para ser usada en esta aplicación.

Founder of DelftStack.com. Jinku has worked in the robotics and automotive industries for over 8 years. He sharpened his coding skills when he needed to do the automatic testing, data collection from remote servers and report creation from the endurance test. He is from an electrical/electronics engineering background but has expanded his interest to embedded electronics, embedded programming and front-/back-end programming.
LinkedIn Facebook