Wie wird eine Liste von x,y-Koordinaten in Matplotlib geplottet
Angenommen, wir haben eine Liste von 2-Tupeln wie (x, y), und wir müssen sie so darstellen, wie sie die (x, y) Koordinaten sind.
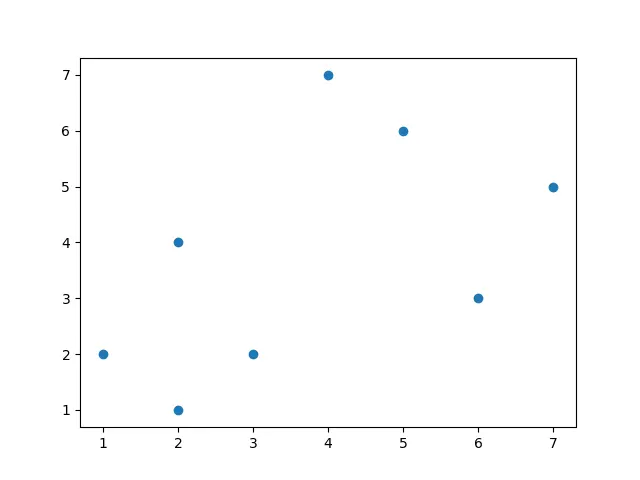
data = [
    [1, 2],
    [3, 2],
    [4, 7],
    [2, 4],
    [2, 1],
    [5, 6],
    [6, 3],
    [7, 5],
]
Vervollständigen Sie die Codes, um diese Liste von (x, y)-Koordinaten in Matplotlib zu zeichnen,
import matplotlib.pyplot as plt

data = [
    [1, 2],
    [3, 2],
    [4, 7],
    [2, 4],
    [2, 1],
    [5, 6],
    [6, 3],
    [7, 5],
]

x, y = zip(*data)
plt.scatter(x, y)
plt.show()
x, y = zip(*data)
Es entpackt die Daten von Paaren in Listen, indem es die zip Funktion verwendet.
plt.scatter(x, y)
Wir müssen die Streudiagramme erstellen, daher ist scatter der richtige Diagrammtyp, der in dieser Anwendung verwendet wird.

Founder of DelftStack.com. Jinku has worked in the robotics and automotive industries for over 8 years. He sharpened his coding skills when he needed to do the automatic testing, data collection from remote servers and report creation from the endurance test. He is from an electrical/electronics engineering background but has expanded his interest to embedded electronics, embedded programming and front-/back-end programming.
LinkedIn Facebook