Traccia l'lista delle coordinate X, y in Matplotlib
Supponiamo di avere una lista di 2-tuple come (x, y) e di doverle tracciare perché sono le coordinate (x, y).
data = [
    [1, 2],
    [3, 2],
    [4, 7],
    [2, 4],
    [2, 1],
    [5, 6],
    [6, 3],
    [7, 5],
]
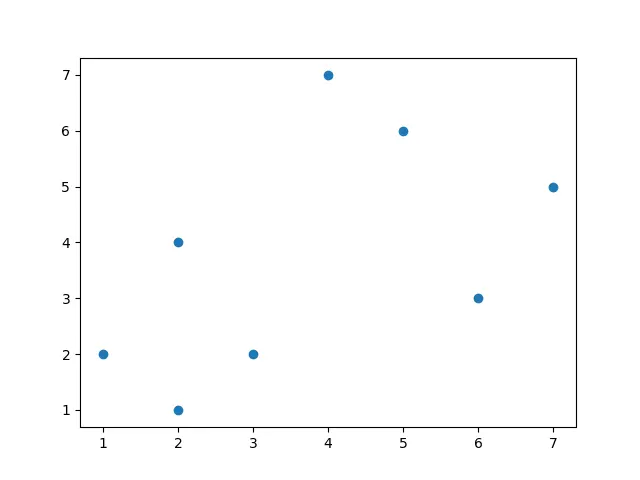
Codici completi per tracciare questo lista di coordinate (x, y) in Matplotlib,
import matplotlib.pyplot as plt

data = [
    [1, 2],
    [3, 2],
    [4, 7],
    [2, 4],
    [2, 1],
    [5, 6],
    [6, 3],
    [7, 5],
]

x, y = zip(*data)
plt.scatter(x, y)
plt.show()
x, y = zip(*data)
Decomprime i dati dalle coppie agli liste utilizzando la funzione zip.
plt.scatter(x, y)
Dobbiamo creare il grafico a dispersione, quindi scatter è il tipo di grafico corretto da utilizzare in questa applicazione.

Founder of DelftStack.com. Jinku has worked in the robotics and automotive industries for over 8 years. He sharpened his coding skills when he needed to do the automatic testing, data collection from remote servers and report creation from the endurance test. He is from an electrical/electronics engineering background but has expanded his interest to embedded electronics, embedded programming and front-/back-end programming.
LinkedIn Facebook