HOWTO · Matplotlib
Matplotlib 에서 모든 서브 플로트에 대한 단일 범례를 만드는 방법
Matplotlib 그림 클래스에는 범례 메서드가 있지만 범례를 그림 수준에는 있지만 하위 그림 수준에는 배치하지 않습니다. 선 패턴과 레이블이 모든 서브 플로트에서 동일하면 특히 편리합니다.
이 페이지의 내용
Matplotlib figure 클래스에는 legend 메소드가 있으며,legend 는 Figure 레벨에 배치하지만 subplot 레벨에는 배치하지 않습니다. 선 패턴과 레이블이 모든 서브 플로트에서 동일하면 특히 편리합니다.
Matplotlib 의 figure.legend 메소드를 사용하여 모든 서브 플롯에 대한 단일 범례 만들기
import matplotlib.pyplot as plt

fig = plt.figure()
axes = fig.subplots(nrows=2, ncols=2)


for ax in fig.axes:
    ax.plot([0, 10], [0, 10], label="linear")

lines, labels = fig.axes[-1].get_legend_handles_labels()

fig.legend(lines, labels, loc="upper center")

plt.show()
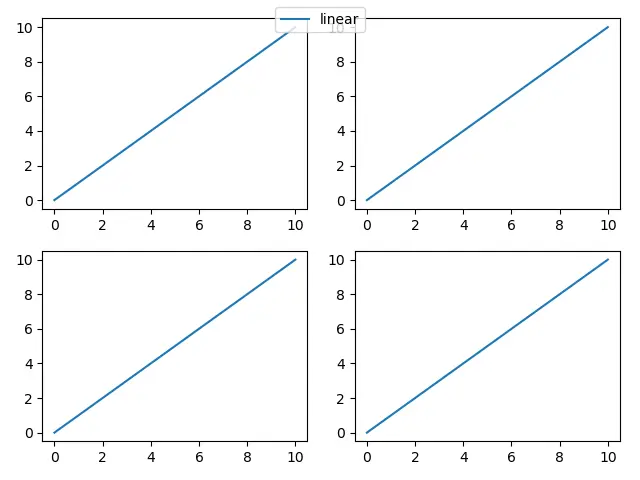
lines, labels = fig.axes[-1].get_legend_handles_labels()
모든 서브 플롯이 같은 선과 레이블을 가지고 있다고 가정하기 때문에 마지막 ‘축’의 마지막 핸들과 레이블을 전체 그림에 사용할 수 있습니다.
Matplotlib 에서 라인 핸들과 라인이 다른 경우 figure.legend 메소드를 사용하여 모든 서브 플롯에 대한 단일 범례 만들기
서브 플롯간에 선 패턴과 레이블이 다르지만 모든 서브 플롯에 단일 범례가 필요한 경우 모든 서브 플롯에서 모든 라인 핸들과 레이블을 가져와야합니다.
import matplotlib.pyplot as plt
import numpy as np

x = np.linspace(0, 10, 501)

fig = plt.figure()
axes = fig.subplots(nrows=2, ncols=2)

axes[0, 0].plot(x, np.sin(x), color="k", label="sin(x)")
axes[0, 1].plot(x, np.cos(x), color="b", label="cos(x)")
axes[1, 0].plot(x, np.sin(x) + np.cos(x), color="r", label="sin(x)+cos(x)")
axes[1, 1].plot(x, np.sin(x) - np.cos(x), color="m", label="sin(x)-cos(x)")

lines = []
labels = []

for ax in fig.axes:
    axLine, axLabel = ax.get_legend_handles_labels()
    lines.extend(axLine)
    labels.extend(axLabel)


fig.legend(lines, labels, loc="upper right")

plt.show()
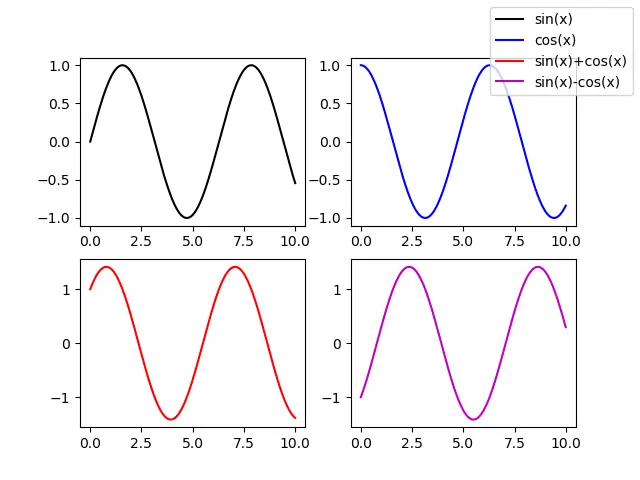
for ax in fig.axes:
    axLine, axLabel = ax.get_legend_handles_labels()
    lines.extend(axLine)
    labels.extend(axLabel)
하나의 서브 플롯에 더 많은 행과 레이블이 존재하는 경우 모든 행 핸들과 레이블이 extend 메소드와 함께 lines 및 labels 목록에 추가됩니다.