How to Increase Heatmap Font Size in Seaborn
-
Using the
sns.set(font_scale)to Increase Heatmap Font Size in Seaborn -
Using the
annot_kwsto Increase Heatmap Font Size in Seaborn - Conclusion
In the dynamic field of data visualization, the ability to convey complex insights through clear and engaging visuals is indispensable. Heatmaps, a widely used tool, offer an intuitive way to represent complex data relationships.
This tutorial is crafted to guide users through a step-by-step process, focusing on practical methods to enhance the font size within Seaborn heatmaps. By delving into this tutorial, users will gain valuable insights into refining the visual appeal and interpretability of their data representations.
Using the sns.set(font_scale) to Increase Heatmap Font Size in Seaborn
The sns.set() function in Seaborn is a versatile tool for configuring aesthetic parameters globally. By leveraging the font_scale parameter, we can effortlessly control the font size throughout the entire plot.
Let’s delve into a practical example using a randomly generated dataset. We can use the sns.set(font_scale) method to enhance the font size of annotations in the heatmap.
import seaborn as sns
import matplotlib.pyplot as plt
import numpy as np

# Generate a random dataset for demonstration
np.random.seed(42)
data = np.random.rand(5, 5)

# Set the font scale using sns.set
sns.set(font_scale=1.5)

# Create the heatmap with Seaborn
ax = sns.heatmap(data, annot=True, cmap="viridis", cbar=True)

# Add labels and title for better interpretation
ax.set_xlabel("X-axis Label")
ax.set_ylabel("Y-axis Label")
ax.set_title("Random Heatmap with Increased Font Size")

# Display the plot
plt.show()
We begin by importing Seaborn, Matplotlib, and NumPy for visualization and dataset generation.
Then, we create a 5x5 random dataset using NumPy for the heatmap demonstration.
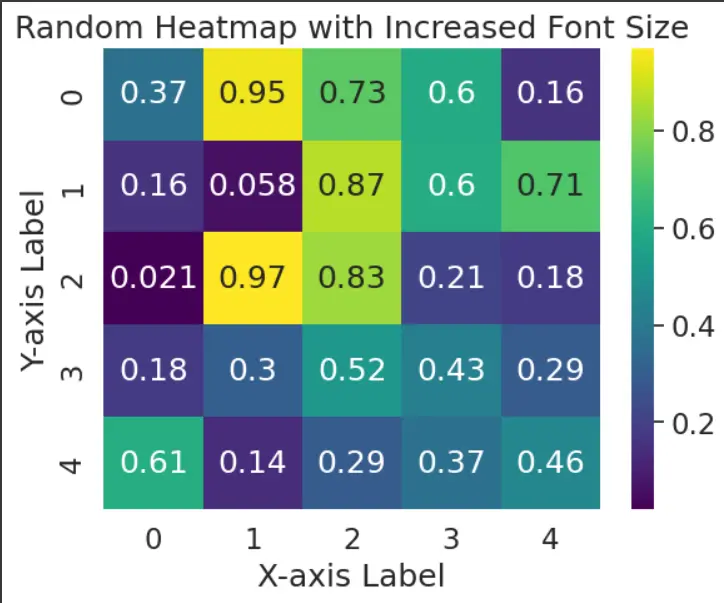
The crucial step is setting the font scale using sns.set(font_scale=1.5). This scales the font size for annotations globally.
We then create the heatmap using sns.heatmap(), incorporating annotations, a colormap (cmap='viridis'), and a color bar (cbar=True).
Finally, we use plt.show() to visualize the heatmap.
Output:
-method.webp)
Using the annot_kws to Increase Heatmap Font Size in Seaborn
The annot_kws parameter within the sns.heatmap() function in Seaborn is a powerful tool for customizing the appearance of annotations in a heatmap. This parameter allows users to pass keyword arguments directly to the underlying Matplotlib text function, providing fine-grained control over various text properties, including font size.
Let’s dive into a practical example using a random dataset. We’ll generate synthetic data and create a Seaborn heatmap, adjusting the font size of the annotations for improved visibility.
import seaborn as sns
import matplotlib.pyplot as plt
import numpy as np

# Generate a random dataset for demonstration
np.random.seed(42)
data = np.random.rand(5, 5)

# Set the font size for annotations using annot_kws
font_size = 12

# Create the heatmap with Seaborn
ax = sns.heatmap(
    data, annot=True, annot_kws={"size": font_size}, cmap="viridis", cbar=True
)

# Add labels and title for better interpretation
ax.set_xlabel("X-axis Label")
ax.set_ylabel("Y-axis Label")
ax.set_title("Random Heatmap with Increased Font Size")

# Display the plot
plt.show()
We begin by importing the necessary libraries, including Seaborn, Matplotlib, and NumPy for generating a random dataset.
Then, we create a random dataset using NumPy, simulating a 5x5 matrix of random values between 0 and 1.
We specify the desired font size for annotations using the font_size variable.
Using the sns.heatmap() function, we generate the heatmap. The annot=True parameter enables annotations, and annot_kws={"size": font_size} sets the font size for the annotations.
We then add axis labels and a title to the heatmap for better interpretation.
Finally, we use plt.show() to display the generated heatmap.
Output:
Conclusion
In conclusion, the annot_kws parameter within the Seaborn library proves to be a versatile asset for users seeking precise control over the font size of annotations in heatmaps. Its seamless integration within the sns.heatmap() function facilitates a streamlined and efficient approach to customization, offering a user-friendly alternative to additional Matplotlib adjustments.
As we navigate the evolving landscape of data visualization, the importance of clear, impactful representations remains paramount. The annot_kws parameter stands as a testament to Seaborn’s commitment to empowering users with the tools they need for effective, visually compelling data analysis.

Hello! I am Salman Bin Mehmood(Baum), a software developer and I help organizations, address complex problems. My expertise lies within back-end, data science and machine learning. I am a lifelong learner, currently working on metaverse, and enrolled in a course building an AI application with python. I love solving problems and developing bug-free software for people. I write content related to python and hot Technologies.
LinkedIn