How to Set Size of Seaborn Heatmap
-
Use the
seaborn.set()Function to Set the Seaborn Heatmap Size -
Use the
matplotlib.pyplot.figure()Function to Set the Seaborn Heatmap Size -
Use the
matplotlib.pyplot.gcf()Function to Set the Size of a Seaborn Plot

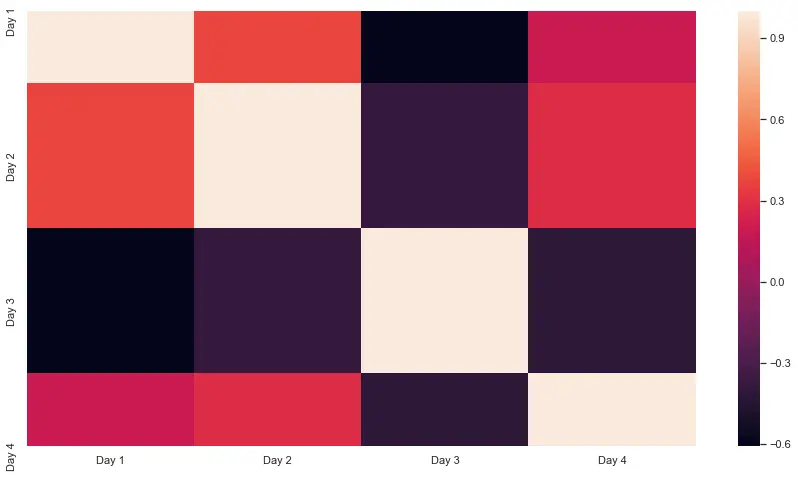
The heatmap is used to produce a graphical representation of a matrix. It plots a matrix on the graph and uses different color shades for different values.
We can use the seaborn.heatmap() function to create heatmap plots in the seaborn module.
While representing a large matrix, the default size of the plot may not provide a clear representation of the data.
In this tutorial, we will tackle this problem and learn how to alter the size of seaborn heatmaps.
Since the heatmap() returns a matplotlib-axes object, we can use functions from that library, too.
Use the seaborn.set() Function to Set the Seaborn Heatmap Size
The set() function defines the configuration and theme of the seaborn plots. We can mention the size of the plot in the rc parameter.
For example,
import pandas as pd
import matplotlib.pyplot as plt
import seaborn as sns

df = pd.DataFrame(
    {
        "Day 1": [7, 1, 5, 6, 3, 10, 5, 8],
        "Day 2": [1, 2, 8, 4, 3, 9, 5, 2],
        "Day 3": [4, 6, 5, 8, 6, 1, 2, 3],
        "Day 4": [5, 8, 9, 5, 1, 7, 8, 9],
    }
)

sns.set(rc={"figure.figsize": (15, 8)})
sns.heatmap(df.corr())

Note that the value for the rc parameter is specified as a dictionary. The final height and width are passed as a tuple.
Use the matplotlib.pyplot.figure() Function to Set the Seaborn Heatmap Size
The figure() function is used to initiate or customize the current figure in Python. The heatmap is plotted in this figure. The size can be altered using the figsize parameter in the function.
For example,
import pandas as pd
import matplotlib.pyplot as plt
import seaborn as sns

df = pd.DataFrame(
    {
        "Day 1": [7, 1, 5, 6, 3, 10, 5, 8],
        "Day 2": [1, 2, 8, 4, 3, 9, 5, 2],
        "Day 3": [4, 6, 5, 8, 6, 1, 2, 3],
        "Day 4": [5, 8, 9, 5, 1, 7, 8, 9],
    }
)


plt.figure(figsize=(15, 8))
sns.heatmap(df.corr())
Note that the function is used before the heatmap() function.
Use the matplotlib.pyplot.gcf() Function to Set the Size of a Seaborn Plot
The gcf() function returns a view instance object of the figure. The size of this object can be altered using the set_size_inches() method. In this way, we can set the size of the heatmap plot on this object.
For example,
import pandas as pd
import matplotlib.pyplot as plt
import seaborn as sns

df = pd.DataFrame(
    {
        "Day 1": [7, 1, 5, 6, 3, 10, 5, 8],
        "Day 2": [1, 2, 8, 4, 3, 9, 5, 2],
        "Day 3": [4, 6, 5, 8, 6, 1, 2, 3],
        "Day 4": [5, 8, 9, 5, 1, 7, 8, 9],
    }
)


sns.heatmap(df.corr())
plt.gcf().set_size_inches(15, 8)

Note that this method is used after the heatmap() function.
Additionally, it should be noted that in all the above-used methods, the size of annotations in the heatmap is not affected much.
To increase the size of annotations, we need to set the annot parameter to True in the heatmap() function. Then we can specify the font size as a key-value pair in the annot_kws parameter like annot_kws = {'size':15}.

Manav is a IT Professional who has a lot of experience as a core developer in many live projects. He is an avid learner who enjoys learning new things and sharing his findings whenever possible.
LinkedIn