How to Create Seaborn BoxPlot

Different statistical graphs and plots can be created using the seaborn module in Python. We can create a box plot using the seaborn.boxplot() function.
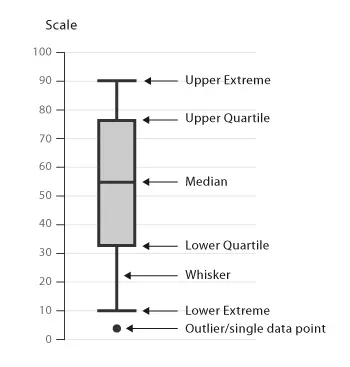
Analysts and statisticians frequently use a box plot to represent data across different levels or categories. The box plot figure can convey many statistical values. The following figure explains this.
The boxplot() function works efficiently in plotting categorical values of a dataset and can also work with single lists or array vectors. It is very similar to the violin plot.
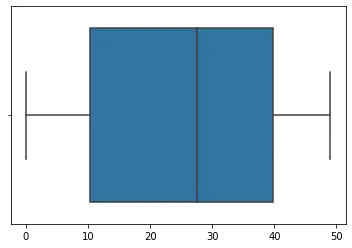
In the following example, we plot a box plot for a single distribution to get some idea of the final figure.
import random
import numpy as np
import seaborn as sns

n = random.sample(range(0, 50), 30)
arr = np.array(n)
sns.boxplot(n)
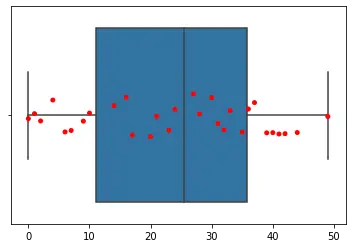
We can also plot a scatter plot over the box plot. It will give you a better understanding of the plotted distribution and the final figure.
We will use the seaborn.stripplot() function to plot the scatter graph. For example,
import random
import numpy as np
import seaborn as sns

n = random.sample(range(0, 50), 30)
arr = np.array(n)
sns.boxplot(n)
sns.stripplot(n, color="red")
The box plot can be efficiently utilized to plot the categorical variables and make their comparison simple. In the following code, we will plot the box plot for multiple categories.
import pandas as pd
import matplotlib.pyplot as plt
import seaborn as sns

df = pd.DataFrame(
    {
        "Quantity": [5, 6, 7, 8, 5, 6, 7, 8, 5, 6, 7, 8, 5, 6, 7, 8],
        "Price": [9, 10, 15, 16, 13, 14, 15, 18, 11, 12, 14, 15, 16, 17, 18, 19],
        "Day": [1, 1, 1, 1, 1, 1, 1, 1, 2, 2, 2, 2, 2, 2, 2, 2],
        "Product": [
            "A",
            "A",
            "A",
            "A",
            "B",
            "B",
            "B",
            "B",
            "A",
            "A",
            "A",
            "A",
            "B",
            "B",
            "B",
            "B",
        ],
    }
)

sns.boxplot(data=df, y="Price", x="Quantity")
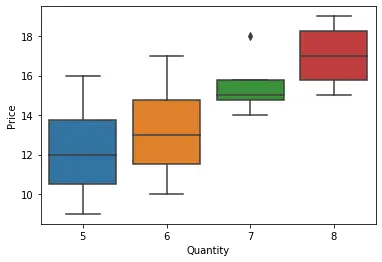
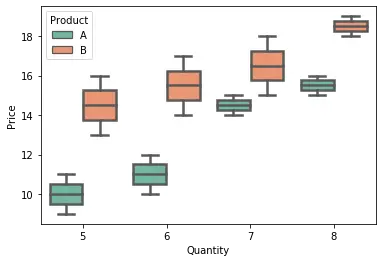
Notice how in the above dataset, we can easily compare the price across different quantities. We can also add the hue parameter and set its value as the Product variable. This way, we will be able to plot different boxes for different products.
We can use the matplotlib.pyplot.ylim() and matplotlib.pyplot.xlim() to set the limits on x and the y axis of the plot.
We can use many more parameters to tweak the final plot. The linewidth parameter can be used to increase the thickness of the borders of the box plot. We can customize the colors for different categories using the palette parameter. The orientation can be changed using the orient argument. There are many more such arguments that can be used.
See the code below to understand the application of some of these parameters.
import pandas as pd
import matplotlib.pyplot as plt
import seaborn as sns

df = pd.DataFrame(
    {
        "Quantity": [5, 6, 7, 8, 5, 6, 7, 8, 5, 6, 7, 8, 5, 6, 7, 8],
        "Price": [9, 10, 15, 16, 13, 14, 15, 18, 11, 12, 14, 15, 16, 17, 18, 19],
        "Day": [1, 1, 1, 1, 1, 1, 1, 1, 2, 2, 2, 2, 2, 2, 2, 2],
        "Product": [
            "A",
            "A",
            "A",
            "A",
            "B",
            "B",
            "B",
            "B",
            "A",
            "A",
            "A",
            "A",
            "B",
            "B",
            "B",
            "B",
        ],
    }
)

sns.boxplot(
    data=df, y="Price", x="Quantity", hue="Product", linewidth=2.5, palette="Set2"
)
We can also use the catplot() function to create a box plot. The catplot() function works very well for plotting categorical values. For creating a box plot using this function, we need to specify the value of the kind parameter in the catplot() function as box.

Manav is a IT Professional who has a lot of experience as a core developer in many live projects. He is an avid learner who enjoys learning new things and sharing his findings whenever possible.
LinkedIn