How to Sum Selected Columns of an R Data Frame
-
Calculate the Sum of Selected Columns in R Using the
rowSums()Function -
Calculate the Sum of Selected Columns in R Using the
apply()Function -
Calculate the Sum of Selected Columns in R Using the
dplyrPackage -
Calculate the Sum of Selected Columns in R Using the
ReduceFunction - Conclusion

Data manipulation is a fundamental aspect of data analysis, and R offers a myriad of tools for performing diverse operations on data frames. One common task is calculating the sum of selected columns, a crucial step in gaining insights into the cumulative values of specific variables.
In this article, we’ll explore several methods in R to achieve this objective, ranging from base R functions like rowSums() and apply() to the expressive capabilities of the dplyr package and the iterative power of the Reduce function.
Calculate the Sum of Selected Columns in R Using the rowSums() Function
In R, the rowSums() function is a powerful tool when it comes to calculating the sum of selected columns in a data frame.
The rowSums() function in R is designed to compute the sum of values across rows in a matrix or data frame. It takes a matrix-like object as input, and by specifying the columns you want to sum, you can easily obtain the sum for each row.
This function is particularly useful when you want to aggregate information across multiple columns. The basic syntax for using rowSums() is as follows:
new_column <- rowSums(data_frame[, selected_columns, drop = FALSE])
Where:
new_column: The name you choose for the new column that will store the sum.data_frame: The name of your data frame.selected_columns: The columns you want to include in the summation, specified either by column names or indices.drop = FALSE: This argument ensures that the result remains a data frame, even if only one column is selected.
Let’s consider a practical example using a data frame named df_students. This data frame contains information about students, including their hobbies and scores in Math, Statistics, and Programming.
# Create five variables.
Student = c("Student A", "Student B", "Student C")
Hobby = c("Music", "Sports", "Cycling")
Maths = c(40, 35, 30)
Statistics = c(30, 35, 20)
Programming = c(25, 20, 35)

# Create a data frame from the variables.
df_students = data.frame(Student, Hobby, Maths, Statistics, Programming)
Now, let’s use the rowSums() function to calculate the sum of the columns Maths, Statistics, and Programming and store the result in a new column named myRowSums.
# Calculate the sum and create a new column.
df_students$myRowSums = rowSums(df_students[, c("Maths", "Statistics", "Programming")])

# Display the data frame with the added column.
cat("Data frame with the sum of the columns:\n")
df_students
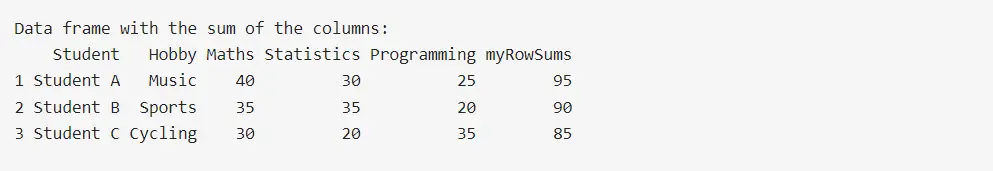
Here, we use the rowSums() function to calculate the sum of selected columns, specifically Maths, Statistics, and Programming. This sum is then stored in a new column named myRowSums within the df_students data frame.
The output showcases the updated data frame, now containing the newly added column with the calculated sums.
Output:
You can also use column positions instead of names, providing more flexibility in your code. Here’s an example:
# Save the column positions as a vector.
col_positions = c(3, 4, 5)

# Calculate the sum using column positions and create a new column.
df_students$myRowSums = rowSums(df_students[, col_positions])

# Display the data frame with the added column.
cat("Data frame with the sum of the columns:\n")
df_students
In this example, we opt for a more dynamic approach by using column positions instead of names. We define a vector, col_positions, to store the positions of the columns we want to sum.
The rowSums() function is then applied to these selected columns, and the result is stored in the same myRowSums column within the df_students data frame. The final output demonstrates the data frame with the newly added column.
Output:
Calculate the Sum of Selected Columns in R Using the apply() Function
In addition to the rowSums() function, R offers another versatile tool for column-wise operations across a data frame – the apply() function. This function provides a flexible way to apply a function to the rows or columns of a matrix or data frame.
In the context of summing selected columns, apply() can be employed to achieve the desired outcome with a slightly different approach. The basic syntax for using apply() is as follows:
new_column <- apply(data_frame[, selected_columns, drop = FALSE], 1, sum)
Where:
new_column: The name for the new column that will store the sum.data_frame: The name of your data frame.selected_columns: The columns you want to include in the summation, specified either by column names or indices.1: The dimension of the data frame to retain;1indicates rows.sum: The function to compute, in this case, calculating the sum.
Let’s use the same df_students data frame from the previous example to showcase how the apply() function works.
# Recreate the data frame from the variables.
df_students = data.frame(Student, Hobby, Maths, Statistics, Programming)

# Create a new column using apply and calculate the sum.
df_students$myApplySums = apply(
    df_students[, c("Maths", "Statistics", "Programming")],
    1, sum
)

# Display the data frame with the added column.
cat("Data frame with the sum of the columns:\n")
df_students
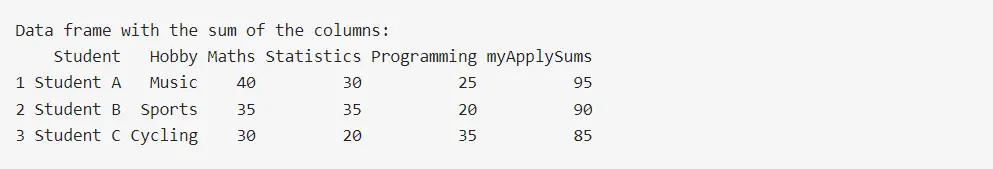
Here, we employ the apply() function to calculate the sum of selected columns, specifically Maths, Statistics, and Programming, across rows. The 1 argument signifies that the operation is row-wise.
The resulting sums are then stored in a new column named myApplySums within the df_students data frame. The output demonstrates the updated data frame with the newly added column, showcasing the calculated sums.
Output:
Similar to the rowSums() example, you can also use column positions instead of names.
# Save the column positions as a vector.
col_positions = c(3, 4, 5)

# Apply and calculate the sum using column positions.
df_students$myApplySums = apply(df_students[, col_positions], 1, sum)

# Display the data frame with the added column.
cat("Data frame with the sum of the columns:\n")
df_students
In this example, we define a vector, col_positions, to store the positions of the columns we want to sum. The apply() function is then applied to calculate the sum across rows for the specified columns, and the results are stored in the same myApplySums column within the df_students data frame.
The final output illustrates the data frame with the added column, reflecting the sums based on the specified column positions.
Output:
Calculate the Sum of Selected Columns in R Using the dplyr Package
The dplyr package in R is a powerful and intuitive tool for data manipulation. It provides a set of functions that simplify the process of subsetting, summarizing, and transforming data frames.
When it comes to calculating the sum of selected columns, the dplyr package offers an elegant and concise solution through its select() and mutate() functions.
The basic syntax for using mutate() in combination with rowwise() and sum() is as follows:
library(dplyr)

new_data_frame <- data_frame %>%
    rowwise() %>%
    mutate(new_column = sum(selected_columns))
Where:
data_frame: The name of your data frame.%>%: The pipe operator used to chain operations.rowwise(): Specifies that subsequent operations should be applied row-wise.mutate(new_column = sum(selected_columns)): Creates a new column (new_column) by summing the specified columns (selected_columns).
Let’s use the same df_students data frame and calculate the sum of selected columns using dplyr.
# Recreate the data frame from the variables.
df_students = data.frame(Student, Hobby, Maths, Statistics, Programming)

# Load the dplyr package.
library(dplyr)

# Create a tibble from the data frame.
tb_students = as_tibble(df_students)

# Calculate the sum using dplyr functions.
tb_students = tb_students %>%
    rowwise() %>%
    mutate(myTidySum = sum(c_across(c("Maths", "Statistics", "Programming"))))

# Display the rowwise tibble with the added column.
cat("Data frame with the sum of the columns:\n")
tb_students
In this example, we start by reconstructing the df_students data frame and loading the dplyr library. We then create a tibble from the data frame and use the %>% operator to chain operations.
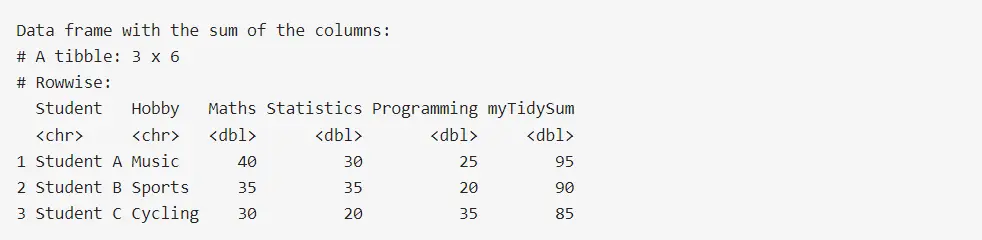
The rowwise() function is employed to specify row-wise operations, and mutate() is used to create a new column named myTidySum. Within the mutate() function, we apply sum(c_across()) to calculate the sum of selected columns (Maths, Statistics, and Programming).
The resulting tibble showcases the new column with the computed sums.
Output:
In the following example, we showcase the flexibility of dplyr by providing alternative ways to specify columns.
# Load the dplyr package.
library(dplyr)

# Create a tibble from the data frame.
tb_students = as_tibble(df_students)

# Calculate the sum using dplyr with alternative column specifications.
tb_students = tb_students %>%
    rowwise() %>%
    mutate(
        unionSum = sum(c_across(c(Maths, Statistics, Programming))),
        rangeSum = sum(c_across(Maths:Programming)),
        positionSum = sum(c_across(3:5)),
        containsSum = sum(
            c_across(
                contains("at") |
                  contains("am")
            )
        ),
        excludeSum = sum(c_across(!c(Student, Hobby)))
    )

# Display the rowwise tibble with the added columns.
cat("Data frame with the sum of the columns:\n")
tb_students
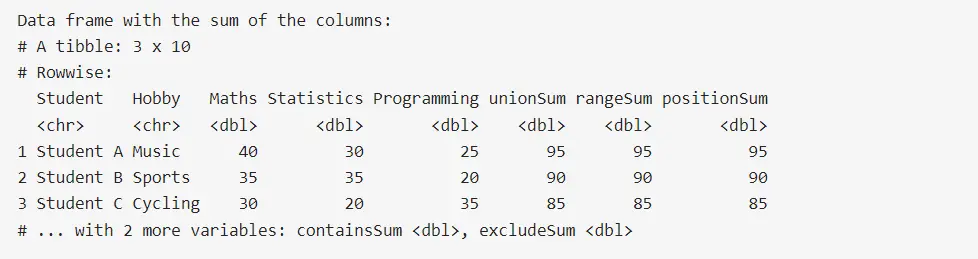
After creating the tibble and employing rowwise(), we use mutate() to add multiple new columns, each showcasing a distinct method of selecting and summing columns. The introduced columns (unionSum, rangeSum, positionSum, containsSum, and excludeSum) illustrate the adaptability of dplyr in accommodating diverse column selection criteria.
The final output displays the tibble with the newly added columns. This demonstrates the flexibility and power of dplyr in handling various data manipulation scenarios.
Output:
The dplyr package in R, especially when used in conjunction with mutate(), provides a flexible tool for calculating the sum of selected columns in a data frame. Its syntax is intuitive, making data manipulation tasks more readable and efficient.
Calculate the Sum of Selected Columns in R Using the Reduce Function
While rowSums() and dplyr provide convenient methods for calculating the sum of selected columns, the Reduce() function in R offers a different approach. The Reduce() function in R is designed to successively apply a binary function to the elements of a vector or other iterable object.
The syntax for using Reduce in this context is as follows:
new_column <- Reduce(FUN = "+", x = data_frame[, selected_columns, drop = FALSE])
Where:
new_column: The name for the new column that will store the sum.FUN = "+": Specifies the binary function to be applied, in this case, addition (+).x = data_frame[, selected_columns, drop = FALSE]: The data frame and selected columns are to be summed.
Let’s use the same df_students data frame to demonstrate how the Reduce function can be employed to calculate the sum of selected columns.
# Recreate the data frame from the variables.
df_students = data.frame(Student, Hobby, Maths, Statistics, Programming)
# Use Reduce to calculate the sum of selected columns.
df_students$myReduceSum = Reduce("+", x = df_students[, c("Maths", "Statistics", "Programming")])
# Display the data frame with the added column.
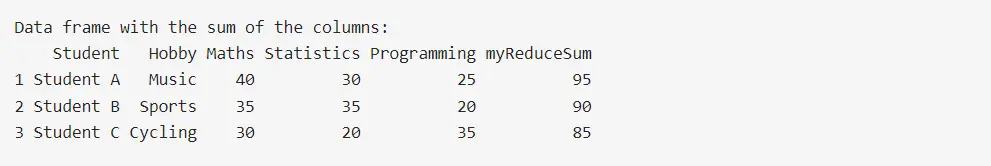
cat("Data frame with the sum of the columns:\n")
df_students
Starting with the df_students data frame, we apply the Reduce function to perform cumulative addition on the specified columns (Maths, Statistics, and Programming). The binary function + is used within Reduce to iteratively sum the selected columns.
The resulting sums are then stored in a new column named myReduceSum within the data frame. The simplicity and efficiency of the Reduce function make it an elegant solution, particularly when dealing with scenarios involving dynamic column selections or a large number of columns.
The output showcases the updated data frame, highlighting the newly added column with the calculated sums.
Output:
Using the Reduce function provides a compact and efficient way to perform cumulative operations on selected columns. The binary function + is applied iteratively, effectively summing the specified columns.
This approach is particularly useful when dealing with a large number of columns or when the selection criteria for columns are dynamic.
Conclusion
Calculating the sum of selected columns in an R data frame is an essential operation in data analysis, and R provides a diverse toolkit to accomplish this task.
The rowSums() function, part of base R, provides a straightforward and efficient method, allowing for flexibility in specifying columns by names or positions. The apply() function is another base R option, offering versatility in its application across rows and columns.
For those seeking a more expressive and readable syntax, the dplyr package introduces functions like mutate() and c_across(), providing an elegant and powerful solution. Lastly, the Reduce function offers an iterative and compact approach for cumulative operations on selected columns, particularly useful in scenarios with dynamic column selections.
The choice of method depends on the specific requirements of the analysis and the preferences of the user. Whether simplicity, readability, or flexibility is prioritized, the diversity of available options in R empowers data analysts to efficiently calculate the sum of selected columns, contributing to the flexibility and adaptability of the language in diverse data manipulation tasks.

Jesse is passionate about data analysis and visualization. He uses the R statistical programming language for all aspects of his work.