HOWTO · R
The scale_x_discrete Function in R
This article introduces how to use scale_x_discrete in R
On this page
This article will introduce the scale_x_discrete function in R.
Use scale_x_discrete to Reverse Order of Items on x Axis in R Plot
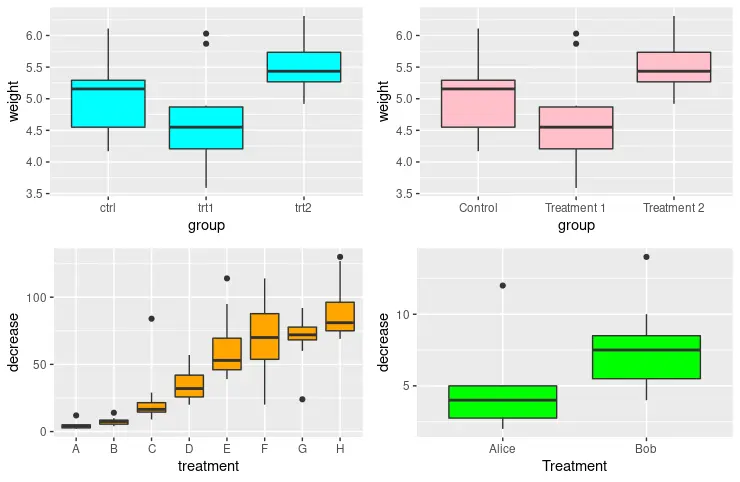
scale_x_discrete is used to set values for discrete x-axis scale aesthetics. In this article, we construct multiple boxplot graphs using ggplot and geom_boxplot functions to demonstrate the effect of different parameters in scale_x_discrete. It’s often the case that the order of items on the axis needs to be reversed, and the easiest method to accomplish this is to set the limits parameter of the scale_x_discrete parameter with the value of rev(levels(dataset_name$X_axis_items)). Notice that the data-set name comes first, followed by the $ symbol, and then we specify the x-axis data that needs to be reversed.
library(ggplot2)
library(gridExtra)

p1 <- ggplot(Loblolly, aes(x = Seed, y = height)) +
  geom_boxplot(fill = "cyan")

p2 <- ggplot(Loblolly, aes(x = Seed, y = height)) +
  geom_boxplot(fill = "orange") +
  scale_x_discrete(limits = rev(levels(Loblolly$Seed)))

grid.arrange(p1, p2, ncol = 2, nrow =2)
Use scale_x_discrete to Display Subset of Items on x Axis in R
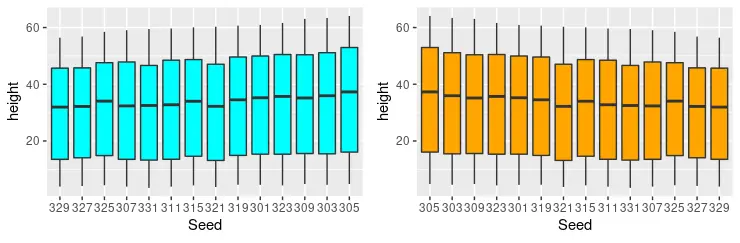
Another useful feature of the scale_x_discrete function is to eliminate some items from the x-axis and draw only a handful of them. In this case, we utilize the PlantGrowth data-set where three categories of groups are listed. Thus, we can output the boxplot with only trt2 and trt1 groups, as shown in the following code snippet.
library(ggplot2)
library(gridExtra)

p1 <- ggplot(Loblolly, aes(x = Seed, y = height)) +
  geom_boxplot(fill = "cyan")

p2 <- ggplot(Loblolly, aes(x = Seed, y = height)) +
  geom_boxplot(fill = "orange") +
  scale_x_discrete(limits = rev(levels(Loblolly$Seed)))

p3 <- ggplot(PlantGrowth, aes(x = group, y = weight)) +
  geom_boxplot(fill = "pink")

p4 <- ggplot(PlantGrowth, aes(x = group, y = weight)) +
  geom_boxplot(fill = "green") +
  scale_x_discrete(limits = c("trt2", "trt1"))

grid.arrange(p1, p2, p3, p4, ncol = 2, nrow =2)
Use scale_x_discrete to Rename Item Labels on x Axis in R
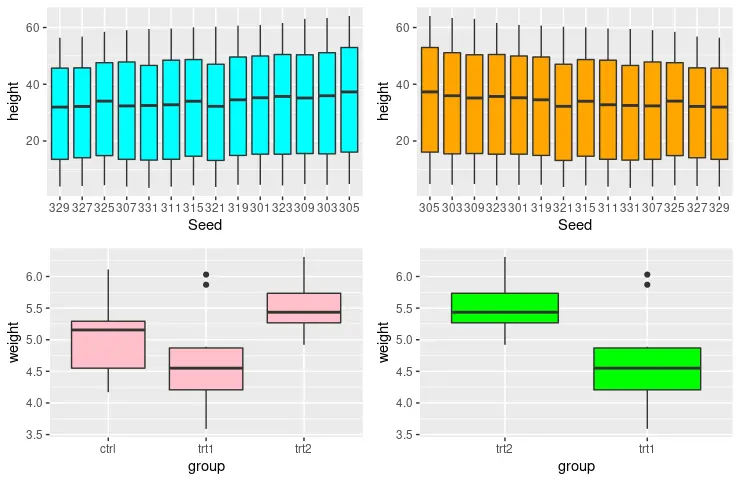
The scale_x_discrete function can also be used to rename item labels along the x-axis. New label values can be supplied with the vector assigned to the labels parameter in the scale_x_discrete function.
library(ggplot2)
library(gridExtra)

p1 <- ggplot(PlantGrowth, aes(x = group, y = weight)) +
  geom_boxplot(fill = "cyan")

p2 <- ggplot(PlantGrowth, aes(x = group, y = weight)) +
  geom_boxplot(fill = "pink") +
  scale_x_discrete(
    labels = c("Control", "Treatment 1", "Treatment 2")
  )

grid.arrange(p1, p2, ncol = 2, nrow =2)
Use scale_x_discrete to Modify x Axis Name in R
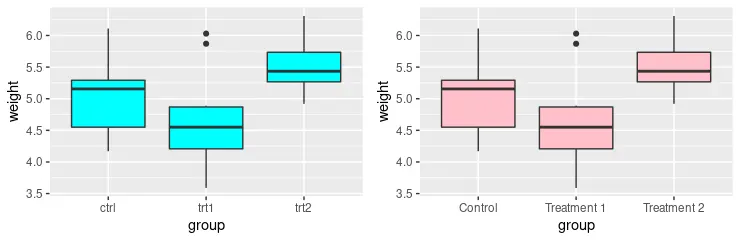
Notice that each previous method can be combined to output desired graph structure. E.g., the following example code draws p4 to show only the subset of items and rename these labels with supplied values. Additionally, we utilize scale_x_discrete to modify the name along the x-axis using the name parameter.
library(ggplot2)
library(gridExtra)

p1 <- ggplot(PlantGrowth, aes(x = group, y = weight)) +
  geom_boxplot(fill = "cyan")

p2 <- ggplot(PlantGrowth, aes(x = group, y = weight)) +
  geom_boxplot(fill = "pink") +
  scale_x_discrete(
    labels = c("Control", "Treatment 1", "Treatment 2")
  )

p3 <- ggplot(OrchardSprays, aes(x = treatment, y = decrease)) +
  geom_boxplot(fill = "orange")

p4 <- ggplot(OrchardSprays, aes(x = treatment, y = decrease)) +
  geom_boxplot(fill = "green") +
  scale_x_discrete(
    limits = c("A", "B"),
    labels = c("Alice", "Bob"),
    name = "Treatment"
  )

grid.arrange(p1, p2, p3, p4, ncol = 2, nrow =2)