R の scale_x_discrete 関数
-
scale_x_discreteを使用して、R プロットのx軸上のアイテムの順序を逆にする -
scale_x_discreteを使用して、R のx軸にアイテムのサブセットを表示する -
scale_x_discreteを使用して、R のx軸のアイテムラベルの名前を変更する -
scale_x_discreteを使用して、R のx軸名を変更する

この記事では、R の scale_x_discrete 関数を紹介します。
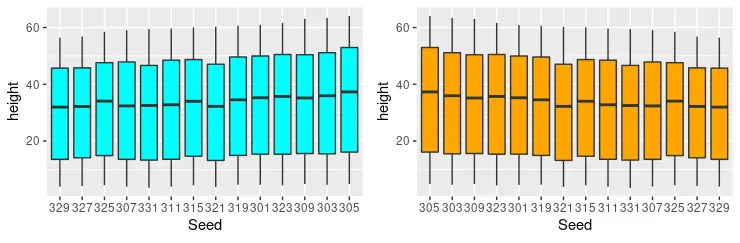
scale_x_discrete を使用して、R プロットの x 軸上のアイテムの順序を逆にする
scale_x_discrete は、離散 x 軸スケールの美学の値を設定するために使用されます。この記事では、ggplot 関数と geom_boxplot 関数を使用して複数の箱ひげ図を作成し、scale_x_discrete のさまざまなパラメーターの効果を示します。通常、軸上の要素の順序を逆にする必要があります。これを実現する最も簡単な方法は、scale_x_discrete パラメーターの limits パラメーターを rev(levels(dataset_name$X_axis_items)) に設定することです。データセット名が最初に来て、次に $ 記号が続き、次に反転する必要がある x 軸データを指定していることに注意してください。
library(ggplot2)
library(gridExtra)

p1 <- ggplot(Loblolly, aes(x = Seed, y = height)) +
  geom_boxplot(fill = "cyan")

p2 <- ggplot(Loblolly, aes(x = Seed, y = height)) +
  geom_boxplot(fill = "orange") +
  scale_x_discrete(limits = rev(levels(Loblolly$Seed)))

grid.arrange(p1, p2, ncol = 2, nrow =2)
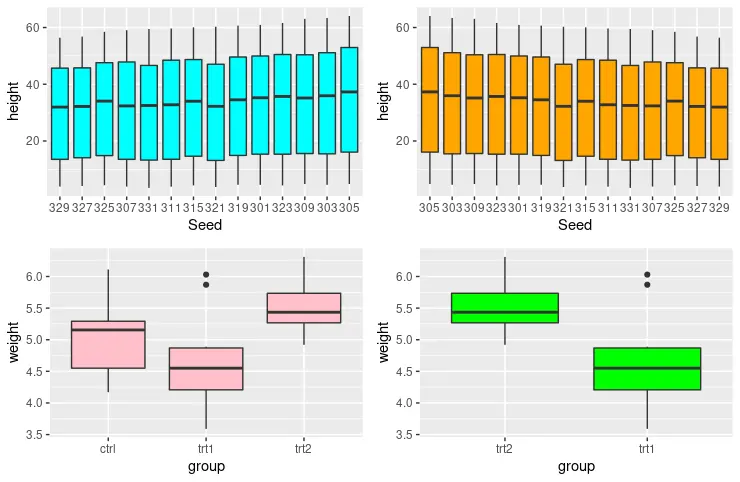
scale_x_discrete を使用して、R の x 軸にアイテムのサブセットを表示する
scale_x_discrete 関数のもう 1つの便利な機能は、x 軸からいくつかのアイテムを削除し、それらのほんの一握りを描画することです。この場合、グループの 3つのカテゴリがリストされている PlantGrowth データセットを利用します。したがって、次のコードスニペットに示すように、trt2 グループと trt1 グループのみで箱ひげ図を出力できます。
library(ggplot2)
library(gridExtra)

p1 <- ggplot(Loblolly, aes(x = Seed, y = height)) +
  geom_boxplot(fill = "cyan")

p2 <- ggplot(Loblolly, aes(x = Seed, y = height)) +
  geom_boxplot(fill = "orange") +
  scale_x_discrete(limits = rev(levels(Loblolly$Seed)))

p3 <- ggplot(PlantGrowth, aes(x = group, y = weight)) +
  geom_boxplot(fill = "pink")

p4 <- ggplot(PlantGrowth, aes(x = group, y = weight)) +
  geom_boxplot(fill = "green") +
  scale_x_discrete(limits = c("trt2", "trt1"))

grid.arrange(p1, p2, p3, p4, ncol = 2, nrow =2)
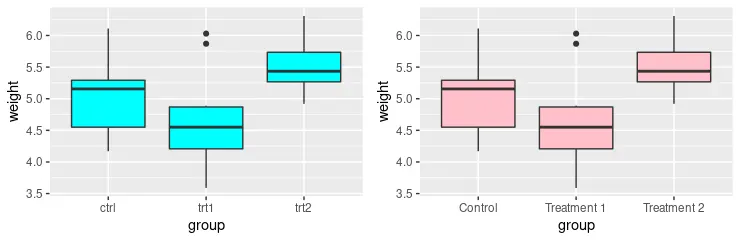
scale_x_discrete を使用して、R の x 軸のアイテムラベルの名前を変更する
scale_x_discrete 関数を使用して、x 軸に沿ってアイテムラベルの名前を変更することもできます。新しいラベル値は、scale_x_discrete 関数の labels パラメーターに割り当てられたベクトルで提供できます。
library(ggplot2)
library(gridExtra)

p1 <- ggplot(PlantGrowth, aes(x = group, y = weight)) +
  geom_boxplot(fill = "cyan")

p2 <- ggplot(PlantGrowth, aes(x = group, y = weight)) +
  geom_boxplot(fill = "pink") +
  scale_x_discrete(
    labels = c("Control", "Treatment 1", "Treatment 2")
  )

grid.arrange(p1, p2, ncol = 2, nrow =2)
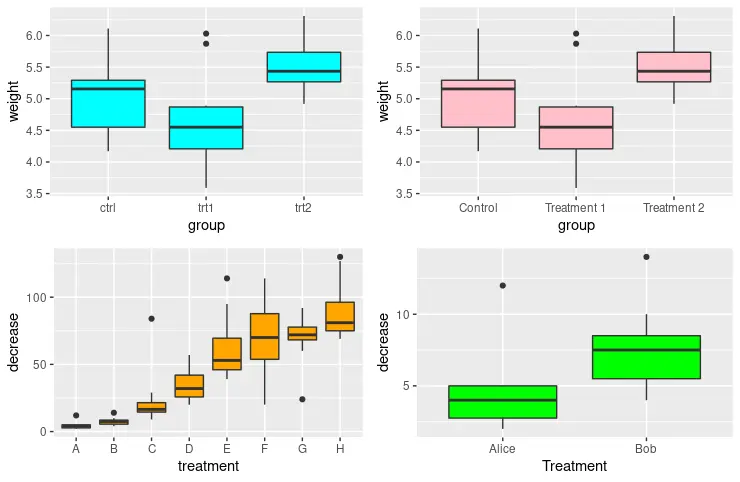
scale_x_discrete を使用して、R の x 軸名を変更する
以前の各方法を組み合わせて、目的のグラフ構造を出力できることに注意してください。たとえば、次のサンプルコードは、p4 を描画してアイテムのサブセットのみを表示し、これらのラベルの名前を指定された値に変更します。さらに、scale_x_discrete を使用して、name パラメーターを使用して x 軸に沿って名前を変更します。
library(ggplot2)
library(gridExtra)

p1 <- ggplot(PlantGrowth, aes(x = group, y = weight)) +
  geom_boxplot(fill = "cyan")

p2 <- ggplot(PlantGrowth, aes(x = group, y = weight)) +
  geom_boxplot(fill = "pink") +
  scale_x_discrete(
    labels = c("Control", "Treatment 1", "Treatment 2")
  )

p3 <- ggplot(OrchardSprays, aes(x = treatment, y = decrease)) +
  geom_boxplot(fill = "orange")

p4 <- ggplot(OrchardSprays, aes(x = treatment, y = decrease)) +
  geom_boxplot(fill = "green") +
  scale_x_discrete(
    limits = c("A", "B"),
    labels = c("Alice", "Bob"),
    name = "Treatment"
  )

grid.arrange(p1, p2, p3, p4, ncol = 2, nrow =2)