Tkinter Graph
Matplotlib is a plotting library for Python that allows us to create some great-looking graphs from our data; this is used in the data science field and in applications where we need to visualize our data analysis. With Matplotlib, we can make some nice visualizations in Python.
This demonstration will teach how to make charts or graphs using Numpy, Matplotlib, and Tkinter in Python.
Create Matplotlib Graph With Tkinter in Python
So now we want to talk just a little bit about graphs. Python for data analysis is super popular in data science and machine learning.
You always create graphs in Tkinter because people want to add buttons or another widget to generate a graph and add flavor to their Matplotlib graphs; fortunately, we can create graphs with Tkinter in Python.
This article will not discuss using matplotlib or numpy; we will assume you already know what those libraries are or how to use them and what we are doing with them.
We will focus on taking data that we have been manipulating with those libraries and then specifically throwing it up on the screen with a graph or a chart or something that we can visualize in Tkinter.
It is very easy and should not take very long, so first, we need to install Numpy and Matplotlib. Numpy is what we use to manipulate the data, and Matplotlib is what we use to throw up the graph on the screen, so now we need to install these into our terminal using the following commands.
pip install numpy
pip install matplotlib
We need to import numpy, tkinter, and matplotlib into our program. It is really simple; we use the following code.
from tkinter import *
import matplotlib.pyplot as plt
import numpy as np
We import numpy as np; this allows us to access numpy by referencing np, instantiating it, and in the same way, we also import matplotlib.
After creating basic things, let’s create a little function called Graph_Generator(). Inside this function, we want to quickly create some data that we can use to make a graph.
We can also import something from a CSV file; if you have data, you can import that. We make some random data to keep it simple, so we call the np.random.normal method from numpy to get the normal distribution for the sample data.
We just passed a few samples of house prices in this method so that the normal distribution will return the average price of a house.
So now we need to create a histogram plot using the hist() method; this method takes independent and dependent variables, passing the normal_dev variable and 200, the dependent variable.
def Graph_Generator():
    # get random dta to visualize normal distribution data
    normal_dev = np.random.normal(200000, 25000, 2000)
    # Create a histogram plot
    plt.hist(normal_dev, 200)
    plt.title("Normal distribution")
    plt.show()
We need to create a button to throw up the graph on the screen when we hit the button on our GUI window, so we call the Graph_Generator() function using the command parameter given in the Button widget.
graph_button = Button(gui_window, text="Generate graph", command=Graph_Generator)
graph_button.pack(pady=30)
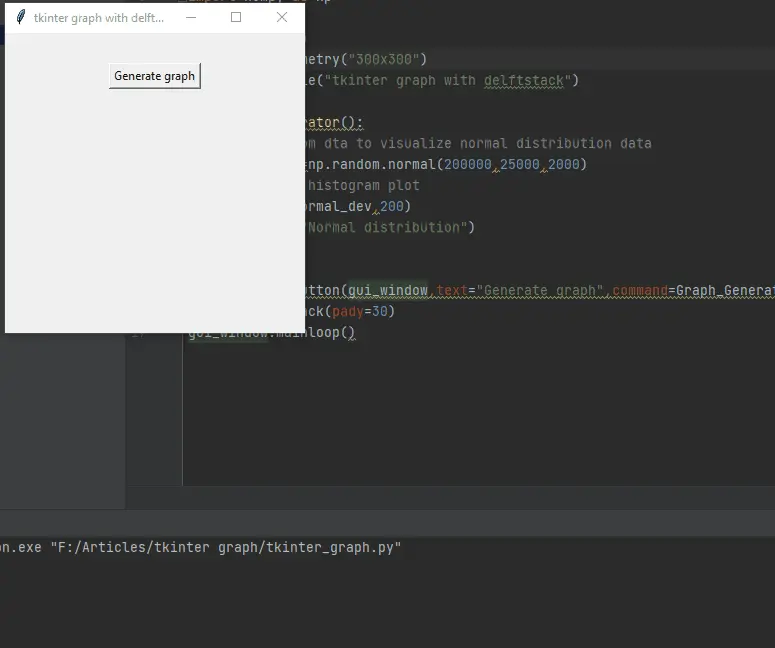
Here is the entire source code, copy and run it on your computer.
from tkinter import *
import matplotlib.pyplot as plt
import numpy as np

gui_window = Tk()
gui_window.geometry("300x300")
gui_window.title("tkinter graph with delftstack")


def Graph_Generator():
    # get random dta to visualize normal distribution data
    normal_dev = np.random.normal(200000, 25000, 2000)
    # Create a histogram plot
    plt.hist(normal_dev, 200)
    plt.title("Normal distribution")
    plt.show()


graph_button = Button(gui_window, text="Generate graph", command=Graph_Generator)
graph_button.pack(pady=30)
gui_window.mainloop()
Output:

Hello! I am Salman Bin Mehmood(Baum), a software developer and I help organizations, address complex problems. My expertise lies within back-end, data science and machine learning. I am a lifelong learner, currently working on metaverse, and enrolled in a course building an AI application with python. I love solving problems and developing bug-free software for people. I write content related to python and hot Technologies.
LinkedIn