Tkinter 圖
Matplotlib 是 Python 的繪相簿,它允許我們從資料中建立一些漂亮的圖形;這用於資料科學領域和我們需要視覺化資料分析的應用程式。使用 Matplotlib,我們可以在 Python 中進行一些漂亮的視覺化。
該演示將教授如何在 Python 中使用 Numpy、Matplotlib 和 Tkinter 製作圖表或圖形。
在 Python 中使用 Tkinter 建立 Matplotlib 圖形
所以現在我們想談談圖表。用於資料分析的 Python 在資料科學和機器學習中非常流行。
你總是在 Tkinter 中建立圖表,因為人們想要新增按鈕或其他元件來生成圖表併為他們的 Matplotlib 圖表新增風味;幸運的是,我們可以在 Python 中使用 Tkinter 建立圖形。
本文不會討論使用 matplotlib 或 numpy;我們假設你已經知道這些庫是什麼或如何使用它們以及我們正在使用它們做什麼。
我們將專注於獲取我們一直在使用這些庫進行操作的資料,然後專門將其與圖形或圖表或我們可以在 Tkinter 中視覺化的東西一起扔到螢幕上。
這很容易,不會花很長時間,所以首先,我們需要安裝 Numpy 和 Matplotlib。Numpy 是我們用來運算元據的工具,而 Matplotlib 是我們用來在螢幕上顯示圖形的工具,所以現在我們需要使用以下命令將它們安裝到我們的終端中。
pip install numpy
pip install matplotlib
我們需要將 numpy、tkinter 和 matplotlib 匯入我們的程式。這真的很簡單;我們使用以下程式碼。
from tkinter import *
import matplotlib.pyplot as plt
import numpy as np
我們將 numpy 匯入為 np;這允許我們通過引用 np 來訪問 numpy,例項化它,同樣,我們還匯入 matplotlib。
在建立了基本的東西之後,讓我們建立一個名為 Graph_Generator() 的小函式。在這個函式中,我們想要快速建立一些可以用來製作圖表的資料。
我們也可以從 CSV 檔案中匯入一些東西;如果你有資料,你可以匯入它。為了簡單起見,我們製作了一些隨機資料,因此我們從 numpy 呼叫 np.random.normal 方法來獲取樣本資料的正態分佈。
我們只是在這個方法中傳遞了幾個房價樣本,這樣正態分佈就會返回房子的平均價格。
所以現在我們需要使用 hist() 方法建立一個直方圖;此方法採用自變數和因變數,傳遞 normal_dev 變數和因變數 200。
def Graph_Generator():
    # get random dta to visualize normal distribution data
    normal_dev = np.random.normal(200000, 25000, 2000)
    # Create a histogram plot
    plt.hist(normal_dev, 200)
    plt.title("Normal distribution")
    plt.show()
當我們點選 GUI 視窗上的按鈕時,我們需要建立一個按鈕以在螢幕上彈出圖形,因此我們使用 Button 元件中給出的命令引數呼叫 Graph_Generator() 函式。
graph_button = Button(gui_window, text="Generate graph", command=Graph_Generator)
graph_button.pack(pady=30)
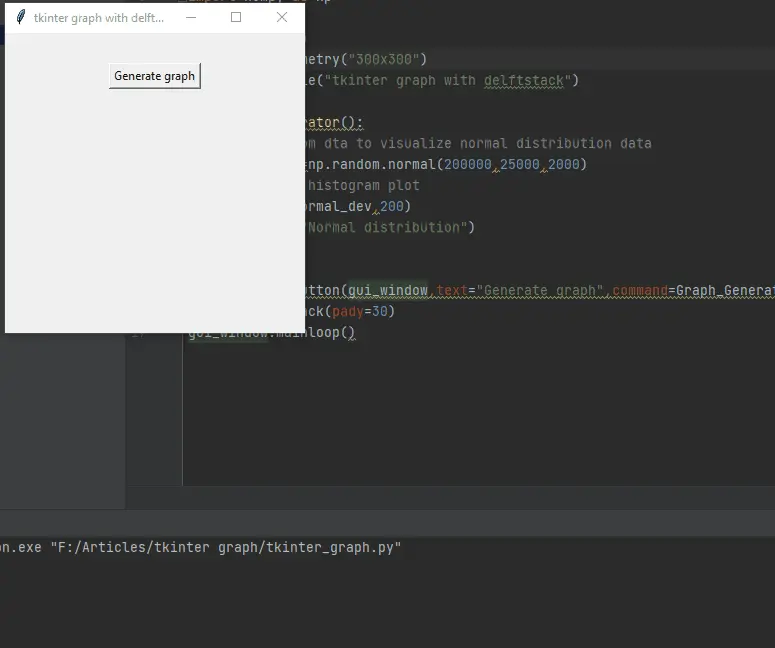
這是整個原始碼,複製並在你的計算機上執行它。
from tkinter import *
import matplotlib.pyplot as plt
import numpy as np

gui_window = Tk()
gui_window.geometry("300x300")
gui_window.title("tkinter graph with delftstack")


def Graph_Generator():
    # get random dta to visualize normal distribution data
    normal_dev = np.random.normal(200000, 25000, 2000)
    # Create a histogram plot
    plt.hist(normal_dev, 200)
    plt.title("Normal distribution")
    plt.show()


graph_button = Button(gui_window, text="Generate graph", command=Graph_Generator)
graph_button.pack(pady=30)
gui_window.mainloop()
輸出:

Hello! I am Salman Bin Mehmood(Baum), a software developer and I help organizations, address complex problems. My expertise lies within back-end, data science and machine learning. I am a lifelong learner, currently working on metaverse, and enrolled in a course building an AI application with python. I love solving problems and developing bug-free software for people. I write content related to python and hot Technologies.
LinkedIn