Tkinter 图
Matplotlib 是 Python 的绘图库,它允许我们从数据中创建一些漂亮的图形;这用于数据科学领域和我们需要可视化数据分析的应用程序。使用 Matplotlib,我们可以在 Python 中进行一些漂亮的可视化。
该演示将教授如何在 Python 中使用 Numpy、Matplotlib 和 Tkinter 制作图表或图形。
在 Python 中使用 Tkinter 创建 Matplotlib 图形
所以现在我们想谈谈图表。用于数据分析的 Python 在数据科学和机器学习中非常流行。
你总是在 Tkinter 中创建图表,因为人们想要添加按钮或其他组件来生成图表并为他们的 Matplotlib 图表添加风味;幸运的是,我们可以在 Python 中使用 Tkinter 创建图形。
本文不会讨论使用 matplotlib 或 numpy;我们假设你已经知道这些库是什么或如何使用它们以及我们正在使用它们做什么。
我们将专注于获取我们一直在使用这些库进行操作的数据,然后专门将其与图形或图表或我们可以在 Tkinter 中可视化的东西一起扔到屏幕上。
这很容易,不会花很长时间,所以首先,我们需要安装 Numpy 和 Matplotlib。Numpy 是我们用来操作数据的工具,而 Matplotlib 是我们用来在屏幕上显示图形的工具,所以现在我们需要使用以下命令将它们安装到我们的终端中。
pip install numpy
pip install matplotlib
我们需要将 numpy、tkinter 和 matplotlib 导入我们的程序。这真的很简单;我们使用以下代码。
from tkinter import *
import matplotlib.pyplot as plt
import numpy as np
我们将 numpy 导入为 np;这允许我们通过引用 np 来访问 numpy,实例化它,同样,我们还导入 matplotlib。
在创建了基本的东西之后,让我们创建一个名为 Graph_Generator() 的小函数。在这个函数中,我们想要快速创建一些可以用来制作图表的数据。
我们也可以从 CSV 文件中导入一些东西;如果你有数据,你可以导入它。为了简单起见,我们制作了一些随机数据,因此我们从 numpy 调用 np.random.normal 方法来获取样本数据的正态分布。
我们只是在这个方法中传递了几个房价样本,这样正态分布就会返回房子的平均价格。
所以现在我们需要使用 hist() 方法创建一个直方图;此方法采用自变量和因变量,传递 normal_dev 变量和因变量 200。
def Graph_Generator():
    # get random dta to visualize normal distribution data
    normal_dev = np.random.normal(200000, 25000, 2000)
    # Create a histogram plot
    plt.hist(normal_dev, 200)
    plt.title("Normal distribution")
    plt.show()
当我们点击 GUI 窗口上的按钮时,我们需要创建一个按钮以在屏幕上弹出图形,因此我们使用 Button 组件中给出的命令参数调用 Graph_Generator() 函数。
graph_button = Button(gui_window, text="Generate graph", command=Graph_Generator)
graph_button.pack(pady=30)
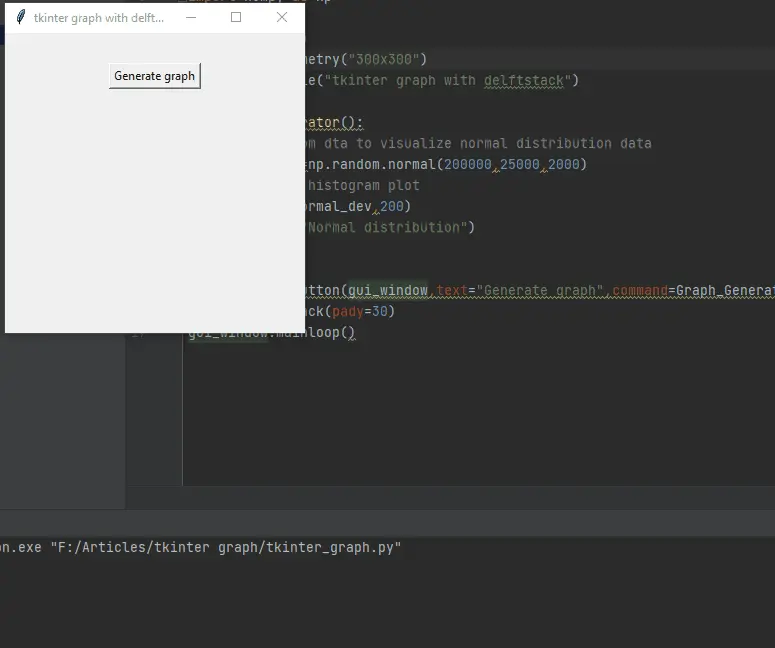
这是整个源代码,复制并在你的计算机上运行它。
from tkinter import *
import matplotlib.pyplot as plt
import numpy as np

gui_window = Tk()
gui_window.geometry("300x300")
gui_window.title("tkinter graph with delftstack")


def Graph_Generator():
    # get random dta to visualize normal distribution data
    normal_dev = np.random.normal(200000, 25000, 2000)
    # Create a histogram plot
    plt.hist(normal_dev, 200)
    plt.title("Normal distribution")
    plt.show()


graph_button = Button(gui_window, text="Generate graph", command=Graph_Generator)
graph_button.pack(pady=30)
gui_window.mainloop()
输出:

Hello! I am Salman Bin Mehmood(Baum), a software developer and I help organizations, address complex problems. My expertise lies within back-end, data science and machine learning. I am a lifelong learner, currently working on metaverse, and enrolled in a course building an AI application with python. I love solving problems and developing bug-free software for people. I write content related to python and hot Technologies.
LinkedIn