How to Groupby Index Columns in Pandas
-
Use the
groupby()Function to Group by Index Columns in Python Pandas -
Use the
groupby()Function on a CSV File Data in Python Pandas

This tutorial introduces how groupby in Python Pandas categorizes data and applies a function to the categories. Use the groupby() function to group multiple index columns in Pandas with examples.
Use the groupby() Function to Group by Index Columns in Python Pandas
In this post, Pandas DataFrame data.groupby() function divides data into groups based on specific criteria. Pandas objects can be divided into any number of groups along any axis.
A label-to-group-name mapping is the abstract definition of grouping. A groupby operation splits an object, applies a function, and combines the results.
This is useful for grouping large amounts of data and performing operations. Pandas groupby default behavior converts the groupby columns into indexes and removes them from the DataFrame’s list of columns.
Syntax:
DataFrame.groupby(
    by=None, axis=0, level=None, as_index=True, sort=True, group_keys=True
)
Parameters:
by |
a mapping, a function, a string, or an iterable |
axis |
int, default value 0 |
level |
For the Multi-Index axis, group by a specific level or levels (hierarchical). |
as_index |
As the index for aggregated output, return an object with group labels. This is only applicable to DataFrame input. When index=False, the output is grouped in “SQL-style”. |
sort |
The keys in a group should be sorted. Turn this off to improve performance. It should be noted that the order of observations within each group is unaffected by this. Groupby maintains the order of rows within each group. |
group_keys |
Add group keys to index when calling apply to identify pieces squeeze: If possible, reduce the dimensionality of the return type; otherwise, return a consistent type. |
Take a DataFrame with two columns: date and item sell. Groupby both date and item sell and get the user’s item-by count.
First, we need to import necessary libraries, pandas and numpy, create three columns, ct, date, and item_sell and pass a set of values to the columns.
import pandas as pd
import numpy as np

data = pd.DataFrame()
data["date"] = ["a", "a", "a", "b"]
data["item_sell"] = ["z", "z", "a", "a"]
data["ct"] = 1
print(data)
Output:
  date item_sell  ct
0    a         z   1
1    a         z   1
2    a         a   1
3    b         a   1
Group by using date and item_sell columns.
import pandas as pd
import numpy as np

data = pd.DataFrame()
data["date"] = ["a", "a", "a", "b"]
data["item_sell"] = ["z", "z", "a", "a"]
data["ct"] = 1
output = pd.pivot_table(data, values="ct", index=["date", "item_sell"], aggfunc=np.sum)
print(output)
Output:
 				ct
date item_sell
a    a           1
     z           2
b    a           1
The groupby() by parameter can now refer to either column names or index level names.
import pandas as pd
import numpy as np

arrays = [
    ["rar", "raz", "bal", "bac", "foa", "foa", "qus", "qus"],
    ["six", "seven", "six", "seven", "six", "seven", "six", "seven"],
]
index = pd.MultiIndex.from_arrays(arrays, names=["first", "second"])
data = pd.DataFrame({"C": [1, 1, 1, 1, 2, 2, 3, 3], "D": np.arange(8)}, index=index)
print(data)
Output:
              C  D
first second
rar   six     1  0
raz   seven   1  1
bal   six     1  2
bac   seven   1  3
foa   six     2  4
      seven   2  5
qus   six     3  6
      seven   3  7
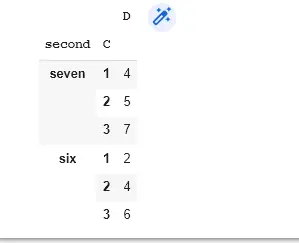
Group by second and C and then calculate the sum using the sum function.
import pandas as pd
import numpy as np

arrays = [
    ["rar", "raz", "bal", "bac", "foa", "foa", "qus", "qus"],
    ["six", "seven", "six", "seven", "six", "seven", "six", "seven"],
]
index = pd.MultiIndex.from_arrays(arrays, names=["first", "second"])
data = pd.DataFrame({"C": [1, 1, 1, 1, 2, 2, 3, 3], "D": np.arange(8)}, index=index)
output = data.groupby(["second", "C"]).sum()
print(output)
Output:
Use the groupby() Function on a CSV File Data in Python Pandas
Now use a groupby() function on a CSV file. To download the CSV file used in the code, click [here](Students Performance in Exams | Kaggle).
The CSV file used is about student performance. To group the data based on gender, use the groupby() function.
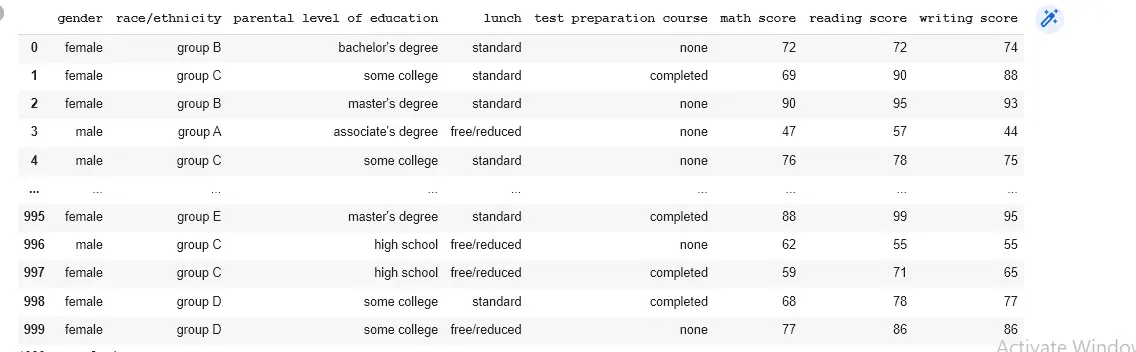
The read_csv function of the Python Pandas library is used to read the file from your drive. Store the file in a data variable.
import pandas as pd

data = pd.read_csv("/content/drive/MyDrive/CSV/StudentsPerformance.csv")
print(data)
Output:
Apply groupby() function.
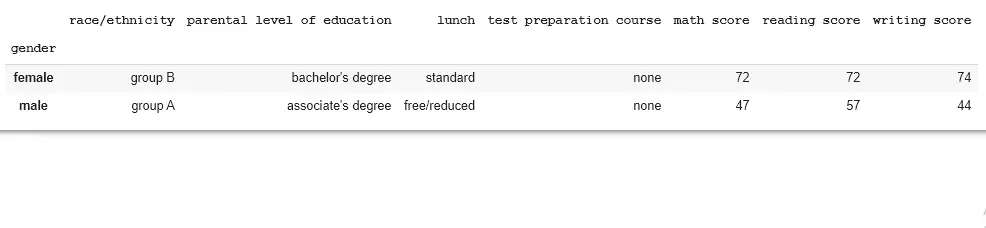
import pandas as pd

data = pd.read_csv("StudentsPerformance.csv")
std = data.groupby("gender")
print(std.first())
Let us print the value in any of the groups. For this, use the team’s name.
The function get_group is used to find the entries in any group. Find the value contained in the female group.
import pandas as pd

data = pd.read_csv("StudentsPerformance.csv")
std = data.groupby("gender")
print(std.get_group("female"))
Output:
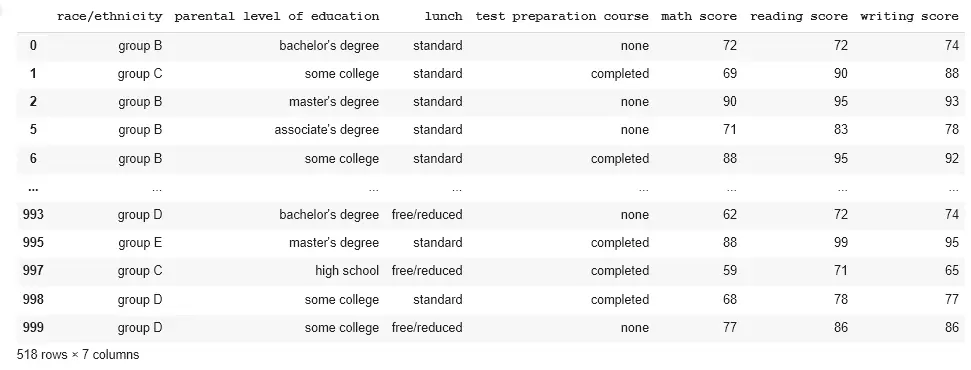
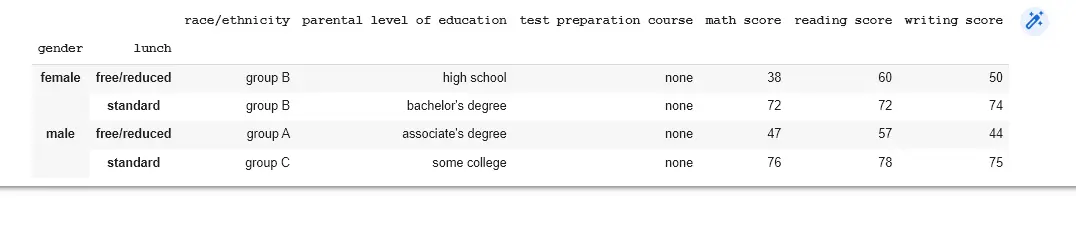
Use the groupby() function to create more than one category group. To split, use more than one column.
import pandas as pd

data = pd.read_csv("StudentsPerformance.csv")
std_per = data.groupby(["gender", "lunch"])
print(std_per.first())
Output:
Groupby() is a versatile function with numerous variants. It makes splitting the DataFrame based on certain criteria very simple and efficient.