Pandas Groupby Describe
Pandas is one of the most useful and widely used libraries for data analysis; however, it isn’t easy to analyze the data, but thankfully Pandas has provided us with many useful functions. And one of the useful functions is the groupby.describe() function.
The describe() is used to quickly summarize the data and provide statistical analysis for any variable or group. The describe() can be applied to the whole data set, single columns, or a group of columns.
The syntax of groupby.describe() is below.
df.groupby("var_a")["var_b"].describe()
Use Pandas groupby().describe() in Python
The groupby() functions help group the data set into subgroups based on different variables. We can group the data set based on one or more than one variable, whereas the describe() functions gives us a statistical analysis of the groups.
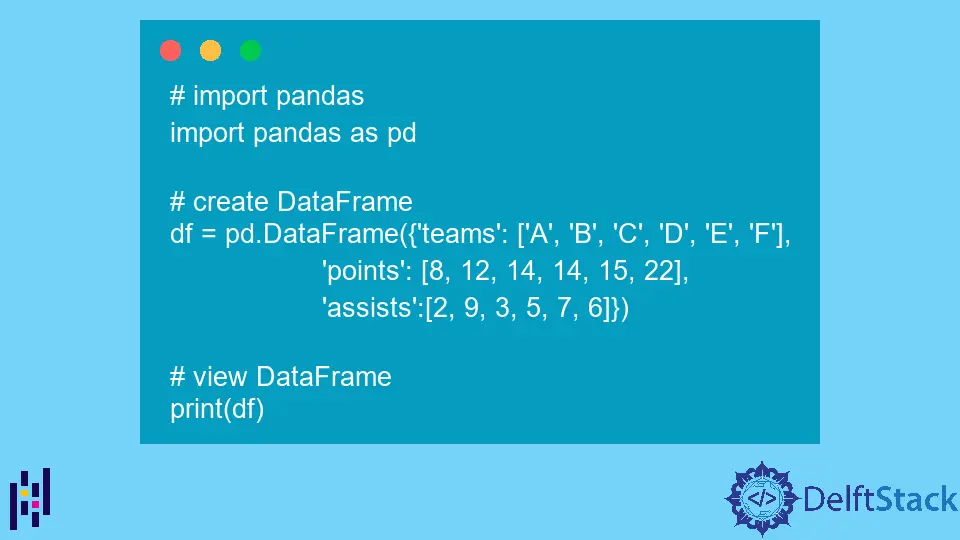
But before going into the details of the group and analyzing the data, first, let’s create a Data Frame.
# import pandas
import pandas as pd

# create DataFrame
df = pd.DataFrame(
    {
        "teams": ["A", "B", "C", "D", "E", "F"],
        "points": [8, 12, 14, 14, 15, 22],
        "assists": [2, 9, 3, 5, 7, 6],
    }
)

# view DataFrame
print(df)
Output:
  	teams  points  assists
0    A       8        2
1    B      12        9
2    C      14        3
3    D      14        5
4    E      15        7
5    F      22        6
So far, we have created a data frame; next, let’s group the data using the groupby() function and see the statistical analysis using the describe().
# import pandas
import pandas as pd

# create DataFrame
df = pd.DataFrame(
    {
        "teams": ["A", "B", "C", "D", "E", "F"],
        "points": [8, 12, 14, 14, 15, 22],
        "assists": [2, 9, 3, 5, 7, 6],
    }
)


# create a group
group = df.groupby("points")
print(group.first())
print("\n\n********** Group stats **********")

# see the stats using
group_stats = df.groupby("points").describe()
print(group_stats)
Output:
team  assists
points
8         A        2
12        B        9
14        C        3
15        E        7
22        F        6


********** Group stats **********
         assists
         count mean       std  min  25%  50%  75%  max
points
8          1.0  2.0       NaN  2.0  2.0  2.0  2.0  2.0
12         1.0  9.0       NaN  9.0  9.0  9.0  9.0  9.0
14         2.0  4.0  1.414214  3.0  3.5  4.0  4.5  5.0
15         1.0  7.0       NaN  7.0  7.0  7.0  7.0  7.0
22         1.0  6.0       NaN  6.0  6.0  6.0  6.0  6.0
As you can see in the above example, we are grouping the data based on points and then applying the describe() as follows group_stats = df.groupby('points').describe(). Now, as you can see, we are seeing the stats like min, max, std, etc.
Conclusion
To summarize the article on how to group data and see the stats using the groupby.describe() function, we have discussed what is groupby() and describe() functions are and how they work. Furthermore, we have discussed the different statistical functions used by the describe() function for analyzing the data in Python.

Zeeshan is a detail oriented software engineer that helps companies and individuals make their lives and easier with software solutions.
LinkedIn