Pandas Groupby 説明
Pandas は、データ分析に最も有用で広く使用されているライブラリの 1つです。 ただし、データを分析するのは簡単ではありませんが、ありがたいことに、Pandas は多くの便利な機能を提供してくれます。 便利な関数の 1つは groupby.describe() 関数です。
describe() は、データをすばやく要約し、変数またはグループの統計分析を提供するために使用されます。 describe() は、データ セット全体、単一の列、または列のグループに適用できます。
groupby.describe() の構文は次のとおりです。
df.groupby("var_a")["var_b"].describe()
Python で Pandas groupby().describe() を使用する
groupby() 関数は、さまざまな変数に基づいてデータ セットをサブグループにグループ化するのに役立ちます。 1つまたは複数の変数に基づいてデータセットをグループ化できますが、describe() 関数はグループの統計分析を提供します。
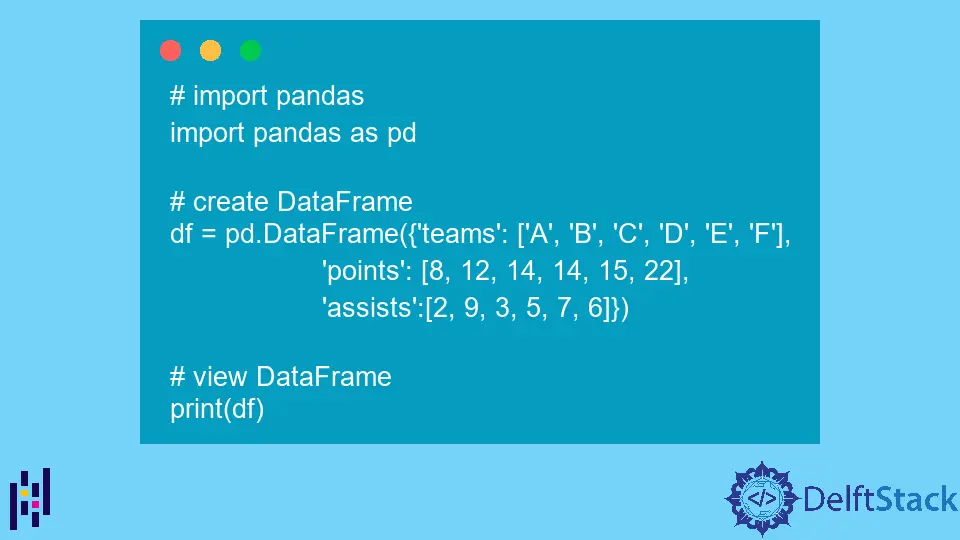
しかし、グループの詳細に進んでデータを分析する前に、まずデータ フレームを作成しましょう。
# import pandas
import pandas as pd

# create DataFrame
df = pd.DataFrame(
    {
        "teams": ["A", "B", "C", "D", "E", "F"],
        "points": [8, 12, 14, 14, 15, 22],
        "assists": [2, 9, 3, 5, 7, 6],
    }
)

# view DataFrame
print(df)
出力:
  	teams  points  assists
0    A       8        2
1    B      12        9
2    C      14        3
3    D      14        5
4    E      15        7
5    F      22        6
ここまでで、データ フレームを作成しました。 次に、groupby() 関数を使用してデータをグループ化し、describe() を使用して統計分析を見てみましょう。
# import pandas
import pandas as pd

# create DataFrame
df = pd.DataFrame(
    {
        "teams": ["A", "B", "C", "D", "E", "F"],
        "points": [8, 12, 14, 14, 15, 22],
        "assists": [2, 9, 3, 5, 7, 6],
    }
)


# create a group
group = df.groupby("points")
print(group.first())
print("\n\n********** Group stats **********")

# see the stats using
group_stats = df.groupby("points").describe()
print(group_stats)
出力:
team  assists
points
8         A        2
12        B        9
14        C        3
15        E        7
22        F        6


********** Group stats **********
         assists
         count mean       std  min  25%  50%  75%  max
points
8          1.0  2.0       NaN  2.0  2.0  2.0  2.0  2.0
12         1.0  9.0       NaN  9.0  9.0  9.0  9.0  9.0
14         2.0  4.0  1.414214  3.0  3.5  4.0  4.5  5.0
15         1.0  7.0       NaN  7.0  7.0  7.0  7.0  7.0
22         1.0  6.0       NaN  6.0  6.0  6.0  6.0  6.0
上記の例でわかるように、points に基づいてデータをグループ化し、group_stats = df.groupby('points').describe() のように describe() を適用しています。 ご覧のとおり、min、max、std などの統計が表示されます。
まとめ
groupby.describe() 関数を使用してデータをグループ化し、統計を表示する方法に関する記事を要約するために、groupby() および describe() 関数とは何か、およびそれらがどのように機能するかについて説明しました。 さらに、Python でデータを分析するために describe() 関数で使用されるさまざまな統計関数について説明しました。

Zeeshan is a detail oriented software engineer that helps companies and individuals make their lives and easier with software solutions.
LinkedIn