Introduction to Pandas Family Tree
This tutorial introduces tree data structure and its types and then deep dive into implementing the family tree (also known as hierarchical tree/general tree) in Python.
Tree Data Structure and Its Importance
In computer science, a tree is inspired by a real-world tree having roots, branches, and leaves; the only difference is that the tree data structure is visualized upside down where the root is at the top of the tree. Let’s have a visual representation below.
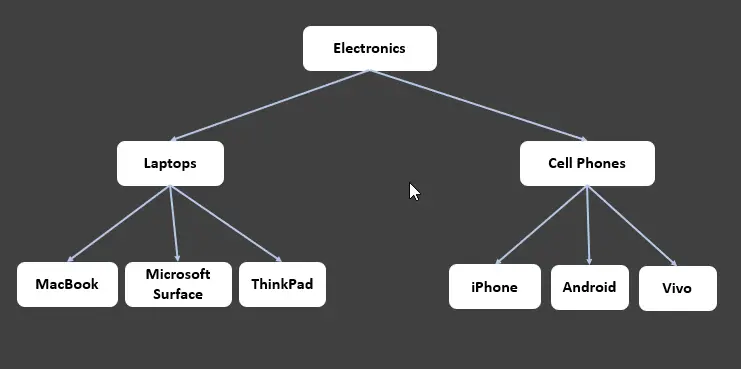
In the above tree, every entity is known as a node. The Electronics node is the root node; it has two child nodes Laptops and Cell Phones, where each child node is the parent of leaf nodes (those nodes which do not have children).
Each arrow is an edge to connect two nodes. We can visualize this as follows.
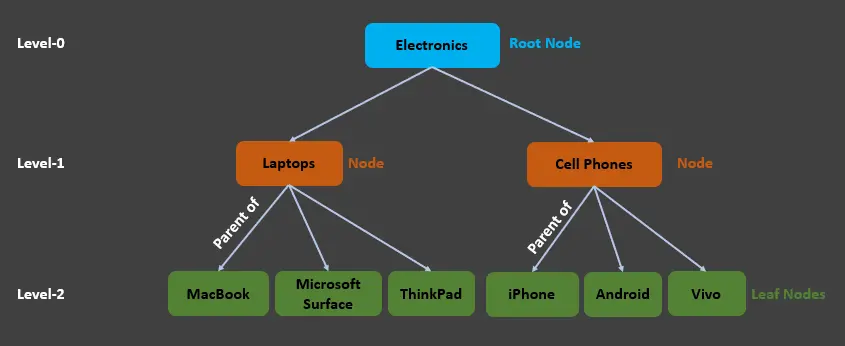
We can see that Level-0 has the root node, which is Electronics, Level-1 has two nodes, Laptops and Cell Phones, where:
Laptopsis the child node ofElectronicsand parent of the leaf nodes (MacBook,Microsoft Surface,ThinkPad).Cell Phonesis the child node ofElectronicsand parent of the leaf nodes (iPhone,Android,Vivo).
We can also say that Electronics and Cell Phones are the Ancestors of the iPhone. Similarly, Cell Phones and iPhone are the descendants of the Electronics node. The same case applies to Laptops.
It is also known as hierarchical data structures due to child-parent hierarchy. It is widely used where simplifying the problem, speeding it up, searching and sorting is required, for instance, file system.
We use trees where we need to represent non-linear data structures. To use a tree data structure, we must satisfy a property that states each tree has a particular root node and each child node has a parent while a parent can have many children.
This property must be satisfied for each tree data structure, but there are different additional properties for different tree data structures.
The types of tree data structure include General Tree, Binary Tree, Binary Search Tree (BST), Adelson-Velshi and Landis (AVL) Tree, Red-Black Tree, and N-ary Tree that you can find here, for this tutorial, we are only focused on General Tree.
Pandas Family Tree
We have a table below where we stored information about the ancestors. There must not be a constraint on children; each node may have an infinite number of child nodes.
So, we are using the general tree to implement the family tree.
In a general tree, there is no restriction on the tree’s hierarchy, and every node can have an unlimited number of child nodes. Note that the general tree is a super-set of all other tree data structures.
Ancestors’ Information Table:
id |
gender |
first_name |
last_name |
dob |
dod |
fid |
mid |
birth_place |
job |
|---|---|---|---|---|---|---|---|---|---|
AnAn |
M | Antonio | Andolini | 1901 | Corleone | ||||
SiAn |
F | Signora | Andolini | 1901 | Corleone | housewife | |||
PaAn87 |
M | Paolo | Andolini | 1887 | 1901 | AnAn |
SiAn |
||
ViCo92 |
M | Vito | Corleone | 1892 | 1954 | AnAn |
SiAn |
Corleone | godfather |
CaCo97 |
F | Carmella | Corleone | 1897 | 1959 | ||||
ToHa10 |
M | Tom | Hagen | 1910 | 1970 | ViCo92 |
CaCo97 |
New York | consigliere |
SaCo16 |
M | Santino | Corleone | 1916 | 1948 | ViCo92 |
CaCo97 |
New York | gangster |
SaCo17 |
F | Sandra | Colombo | 1917 | Messina | ||||
FrCo19 |
M | Frederico | Corleone | 1919 | 1959 | ViCo92 |
CaCo97 |
New York | casino manager |
MiCo20 |
M | Michael | Corleone | 1920 | 1997 | ViCo92 |
CaCo97 |
New York | godfather |
ThHa20 |
F | Theresa | Hagen | 1920 | New Jersey | art expert | |||
LuMa23 |
F | Lucy | Mancini | 1923 | hotel employee | ||||
KaAd24 |
F | Kay | Adams | 1934 | |||||
FrCo37 |
F | Francessa | Corleone | 1937 | SaCo16 |
SaCo17 |
|||
KaCo37 |
F | Kathryn | Corleone | 1937 | SaCo16 |
SaCo17 |
|||
FrCo40 |
F | Frank | Corleone | 1940 | SaCo16 |
SaCo17 |
|||
SaCo45 |
M | Santino Jr. | Corleone | 1945 | SaCo16 |
SaCo17 |
|||
FrHa |
M | Frank | Hagen | 1940 | ToHa10 |
Th20 |
|||
AnHa42 |
M | Andrew | Hagen | 1942 | ToHa10 |
Th20 |
priest | ||
ViMa |
M | Vincent | Mancini | 1948 | SaCo16 |
LuMa23 |
New York | godfather | |
GiHa58 |
F | Gianna | Hagen | 1948 | ToHa10 |
Th20 |
|||
AnCo51 |
M | Anthony | Corleone | 1951 | MiCo20 |
KaAd24 |
New York | singer | |
MaCo53 |
F | Mary | Corleone | 1953 | 1979 | MiCo20 |
KaAd24 |
New York | student |
ChHa54 |
F | Christina | Hagen | 1954 | ToHa10 |
Th20 |
|||
CoCo27 |
F | Constanzia | Corleone | 1927 | ViCo92 |
CaCo97 |
New York | rentier | |
CaRi20 |
M | Carlo | Rizzi | 1920 | 1955 | Nevada | bookmaker | ||
ViRi49 |
M | Victor | Rizzi | 1949 | CaRi20 |
CoCo27 |
New York | ||
MiRi |
M | Michael | Rizzi | 1955 | CaRi20 |
CoCo27 |
We can see the relationship between individuals as the direct acyclic graph (DAG), but we will be using a graph drawing to represent this table as a family tree by following the given steps below.
{{ % step %}}
-
Import Required Libraries and Read Data
import pandas as pd
import numpy as np
from graphviz import Digraph
We import the
pandaslibrary for reading data from a.csvfile and use data frames for manipulating data. Then, we importnumpyandgraphvizto work with arrays and generate a direct acyclic graph (DAG), respectively. -
Read Data
rawdf = pd.read_csv("./data.csv", keep_default_na=False)The
read_csv()method is used to read thedata.csvfile whilekeep_default_na=Falseis used to have blank cells instead ofNaN. -
Transform Table into an Edge List
Next, we have to go through the following code to transform our table into an edge list where the start vertex is the
id, and the end vertex is theParentID.Create Two Data Frames:
```python
element1 = rawdf[["id", "mid"]]
element2 = rawdf[["id", "fid"]]

print(
    "'element1' head data:\n",
    element1.head(),
    "\n\n",
    "'element2' head data: \n",
    element2.head(),
)
```

Output:

```text
'element1' head data:
	  id   mid
0    AnAn
1    SiAn
2 PaAn87 SiAn
3 ViCo92 SiAn
4 CaCo97

'element2' head data:
	  id   fid
0    AnAn
1    SiAn
2 PaAn87 AnAn
3 ViCo92 AnAn
4 CaCo97
```
Here, we make two new data frames, `element1` and `element2`, where the `element1` data frame has two columns, `id` and `mid`, while the `element2` data frame has `id` and `fid` as its columns.
Rename the Column Names:
<!--adsense-->
```python
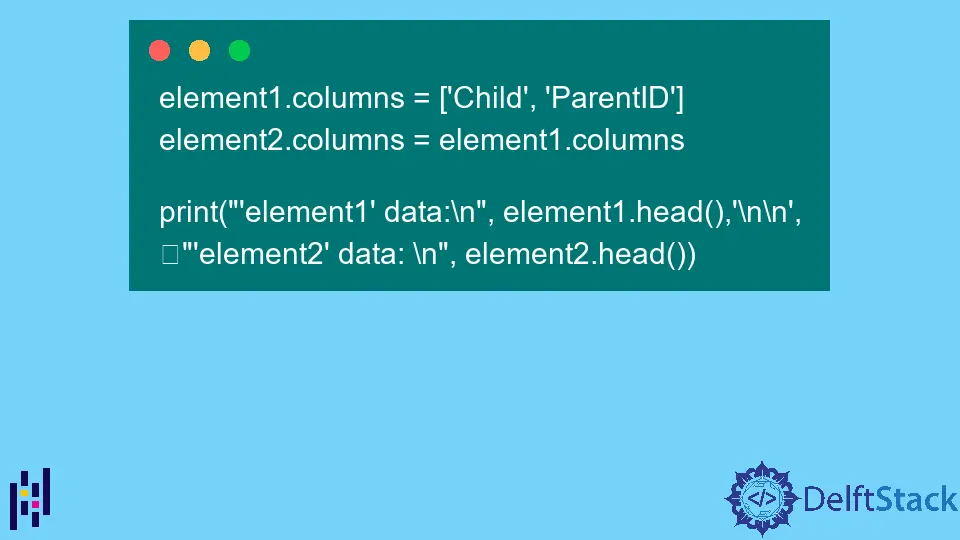
element1.columns = ["Child", "ParentID"]
element2.columns = element1.columns
print(
"'element1' data:\n",
element1.head(),
"\n\n",
"'element2' data: \n",
element2.head(),
)
```
Output:
```text
'element1' data:
   Child ParentID
0    AnAn
1    SiAn
2 PaAn87     SiAn
3 ViCo92     SiAn
4 CaCo97

'element2' data:
   Child ParentID
0    AnAn
1    SiAn
2 PaAn87     AnAn
3 ViCo92     AnAn
4 CaCo97
```

The above code snippet renames the column names of `element1` and `element2` data frames to `Child` and `ParentID`, as shown in the above output.

Concatenate Data Frames and Replace Blank Cells with `NaN`:

```python
element = pd.concat([element1, element2])
element.replace("", np.nan, regex=True, inplace=True)
print(element.head())
```

Output:
```text
  Child ParentID
0    AnAn      NaN
1    SiAn      NaN
2 PaAn87     SiAn
3 ViCo92     SiAn
4 CaCo97      NaN
```

The `concat()` method is used to concatenate `element1` and `element2` data frames to make a new data frame called `element` while the `replace()` method replaces blank cells with `NaN`.

Replace Each Blank in `ParentID` with a Particular String:

```python
t = pd.DataFrame({"tmp": ["no_entry" + str(i) for i in range(element.shape[0])]})
element["ParentID"].fillna(t["tmp"], inplace=True)
```

Merge Data Frames:

```python
df = element.merge(rawdf, left_index=True, right_index=True, how="left")
print(df.head())
```

Output:
```text
  Child   ParentID      id gender first_name last_name   dob   dod   fid  \
0    AnAn no_entry0    AnAn      M    Antonio Andolini        1901
0    AnAn no_entry0    AnAn      M    Antonio Andolini        1901
1    SiAn no_entry1    SiAn      F    Signora Andolini        1901
1    SiAn no_entry1    SiAn      F    Signora Andolini        1901
2 PaAn87       SiAn PaAn87      M      Paolo Andolini 1887 1901 AnAn

  mid birth_place        job
0          Corleone
0          Corleone
1          Corleone housewife
1          Corleone housewife
2 SiAn
```

Here, we use `merge()` to update the data of two data frames by using the specified method(s) to merge them. We use specific parameters to control which data values should be replaced and which should be kept.

For that, we are using the following parameters briefly described below.

1. `rawdf` - Required data frame to merge with.
2. `left_index` - Based on its value, we can decide whether to use the left data frame's index as a joining key.

	If it is set to `True`, then we can use it; otherwise, not. By default, its value is `False`.

3. `right_index` - It is similar to the `left_index` but here, we have to decide whether we can use the right data frame's index as a joining key.

	If it is set to `True`, then we can use it; otherwise, not. By default, its value is also `False`.
4. `how` - It indicates how to merge `left`, `outer`, `right`, `cross`, or `inner`. By default, its value is `inner`.

Create a `name` Column Having Full Name:

```python
df["name"] = df[df.columns[4:6]].apply(
    lambda x: " ".join(x.dropna().astype(str)), axis=1
)
print(df.head())
```

Output:

```text
  Child   ParentID      id gender first_name last_name   dob   dod   fid  \
0    AnAn no_entry0    AnAn      M    Antonio Andolini        1901
0    AnAn no_entry0    AnAn      M    Antonio Andolini        1901
1    SiAn no_entry1    SiAn      F    Signora Andolini        1901
1    SiAn no_entry1    SiAn      F    Signora Andolini        1901
2 PaAn87       SiAn PaAn87      M      Paolo Andolini 1887 1901 AnAn

  mid birth_place        job              name
0          Corleone             Antonio Andolini
0          Corleone             Antonio Andolini
1          Corleone housewife Signora Andolini
1          Corleone housewife Signora Andolini
2 SiAn                           Paolo Andolini
```
Here, we use the `lambda` expression to iterate over each row and join `first_name` and `last_name`. Then, we place this full name in a new column called `name`, as seen in the above output.

Drop a Few Columns and Change the Order of Columns in the `df` Data Frame:

<!--adsense-->

```python
df = df.drop(["Child", "fid", "mid", "first_name", "last_name"], axis=1)
df = df[["id", "name", "gender", "dob", "dod", "birth_place", "job", "ParentID"]]
print(df.head())
```

Output:

```text
	 id              name gender   dob   dod birth_place        job ParentID
0    AnAn Antonio Andolini      M        1901    Corleone             no_entry0
0    AnAn Antonio Andolini      M        1901    Corleone             no_entry0
1    SiAn Signora Andolini      F        1901    Corleone housewife no_entry1
1    SiAn Signora Andolini      F        1901    Corleone housewife no_entry1
2 PaAn87    Paolo Andolini      M 1887 1901                         SiAn
```

First, we drop the `Child`, `fid`, `mid`, `first_name`, and `last_name` columns from the `df` data frame and change the order of columns, as you can see in the resulting data frame.
-
Generate Direct Acyclic Graph (DAG)
You must have
graphvizon your system to generate DAG.
```python
f = Digraph(
"neato",
format="pdf",
encoding="utf8",
filename="data",
node_attr={"color": "lightblue2", "style": "filled"},
)
f.attr("node", shape="box")
for index, record in df.iterrows():
f.edge(str(record["ParentID"]), str(record["id"]), label="")
f.view()
```
This code snippet uses `graphviz`'s `Digraph()` class which takes a few attributes and creates a directed graph description in [DOT](https://www.graphviz.org/doc/info/lang.html) language, we save this reference in the `f` variable which is chained with `.attr()` method to specify the node's shape.
Finally, we iterate the `df` data frame to create edges and view the graph using `f.view()`.
Output:

Suppose we want to have the following things in our graph:
1. One color for females and another color for males.
2. Replacing names with IDs
3. Arrows that look like family tree arrows
4. To add more details in each box (node), for instance, `job`, `dob`, `dod` etc.
To do that, execute the following code:

```python
f = Digraph(
    "neato",
    format="jpg",
    encoding="utf8",
    filename="detailed_data",
    node_attr={"style": "filled"},
    graph_attr={"concentrate": "true", "splines": "ortho"},
)
f.attr("node", shape="box")

for index, row in df.iterrows():
    f.node(
        row["id"],
        label=row["name"]
        + "\n"
        + row["job"]
        + "\n"
        + str(row["dob"])
        + "\n"
        + row["birth_place"]
        + "\n"
        + str(row["dod"]),
        _attributes={
            "color": "lightpink"
            if row["gender"] == "F"
            else "lightblue"
            if row["gender"] == "M"
            else "lightgray"
        },
    )

for index, row in df.iterrows():
    f.edge(str(row["ParentID"]), str(row["id"]), label="")
f.view()
```
Output:

We use `graph_attr={"concentrate": "true", "splines": "ortho"})` to group edges with the exact starting and ending node and with square edges. The `label=` is used to display `name`, `job`, `dob`, `birth_place` and `dod` for the graph nodes.
The `_attributes={'color':'lightpink' if row['S']=='F' else 'lightblue' if row['S']=='M' else 'lightgray'}` is used to define colors for each node according to their `gender` property. You can find the complete source code below.
{{ % /step %}}
Complete Source Code:
import pandas as pd
import numpy as np
from graphviz import Digraph

rawdf = pd.read_csv("./data.csv", keep_default_na=False)
element1 = rawdf[["id", "mid"]]
element2 = rawdf[["id", "fid"]]
element1.columns = ["Child", "ParentID"]
element2.columns = element1.columns

element = pd.concat([element1, element2])
element.replace("", np.nan, regex=True, inplace=True)
t = pd.DataFrame({"tmp": ["no_entry" + str(i) for i in range(element.shape[0])]})
element["ParentID"].fillna(t["tmp"], inplace=True)
df = element.merge(rawdf, left_index=True, right_index=True, how="left")

df["name"] = df[df.columns[4:6]].apply(
    lambda x: " ".join(x.dropna().astype(str)), axis=1
)
df = df.drop(["Child", "fid", "mid", "first_name", "last_name"], axis=1)
df = df[["id", "name", "gender", "dob", "dod", "birth_place", "job", "ParentID"]]

f = Digraph(
    "neato",
    format="pdf",
    encoding="utf8",
    filename="data",
    node_attr={"color": "lightblue2", "style": "filled"},
)
f.attr("node", shape="box")

for index, record in df.iterrows():
    f.edge(str(record["ParentID"]), str(record["id"]), label="")
f.view()

f = Digraph(
    "neato",
    format="jpg",
    encoding="utf8",
    filename="detailed_data",
    node_attr={"style": "filled"},
    graph_attr={"concentrate": "true", "splines": "ortho"},
)
f.attr("node", shape="box")

for index, row in df.iterrows():
    f.node(
        row["id"],
        label=row["name"]
        + "\n"
        + row["job"]
        + "\n"
        + str(row["dob"])
        + "\n"
        + row["birth_place"]
        + "\n"
        + str(row["dod"]),
        _attributes={
            "color": "lightpink"
            if row["gender"] == "F"
            else "lightblue"
            if row["gender"] == "M"
            else "lightgray"
        },
    )

for index, row in df.iterrows():
    f.edge(str(row["ParentID"]), str(row["id"]), label="")
f.view()